Download
1 / 18
180 likes | 344 Views
2001. A WATER ODYSSEY. Lesotho Highlands Water Distribution. Normal Emergency. Phase 1A Project Cost R9.3 bil. R 13.9 Billion. Phase 1B Project Cost. R 6.5 Billion Estimated Cost to March 2003. Funding Sources. Export Credit Loans. Forex Market. Commercial Loans.

E N D
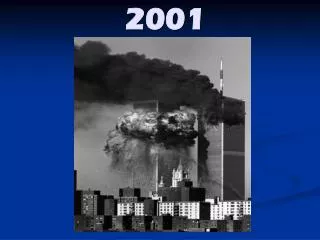
2001 A WATER ODYSSEY
Lesotho Highlands Water Distribution Normal Emergency
Phase 1A Project Cost R9.3 bil R 13.9 Billion
Phase 1B Project Cost R 6.5 Billion Estimated Cost to March 2003
Funding Sources Export Credit Loans Forex Market Commercial Loans Funding Sources Bondmarket Other Loans Local Market Commercial Paper Programme
Phase 1A Sources of Funding R 9.6 Billion
Phase 1B Sources of Funding R 6.5 Billion
Composition of Liabilities R 14 Billion
Debt Maturity Profile & Liability Curve Forecast 30 Current 25 20 15 Rand Billions WS04 & other 10 WS03 WS01 5 WS02 CPP 01 02 03 04 05 06 07 08 09 10 11 12 13 14 15 16 17 18 19 20 21 22 23 24 March
LHWP: Water Flow and Cost Recovery Arrangements TCTA Payment of Delivers LHWP levy/tariff water DWAF DWAF Raw water tariff Raw water Delivers raw water Tariff Other Large Users (Eskom, Sasol,etc) OTHER LARGE Water Boards WATER CONSUMERS BOARDS (Eskom, Sasol) Purified water delivered Local Authorities MUNICIPALITIES End User END USER
Timing of New Schemes Lower Demand
Comparison of Growth in Demand between 1997/98 and 2000 Period : 2000 - 2030 1997/98 2000 3.64 % 2.18 % 2.89 % 1.72 % Most Probable demand scenario Low demand scenario
Royalties • Constitutes of cost savings between LHWP and OVTS (70 m3/s scheme) • Sharing of benefit: 56 % Lesotho vs 44 % RSA • Lesotho: Royalties paid RSA: Lower cost of Project
Royalties • Fixed royalty = Capital cost saving (paid over 50 years) • Variable royalty = Lower O&M and electricity cost (based on volume of water delivered)