Download
1 / 58
610 likes | 1.11k Views
Investigation 7 CELL DIVISION: MITOSIS AND MEIOSIS. Part 2: Effects of Environment on Mitosis: You have been asked to investigate whether the fungal pathogen lectin affects the number of cells undergoing mitosis in a different plant, using root tips. Mitosis and Meiosis. Mitosis.

E N D
Investigation 7 CELL DIVISION: MITOSIS AND MEIOSIS Part 2: Effects of Environment on Mitosis: • You have been asked to investigate whether the fungal pathogen lectin affects the number of cells undergoing mitosis in a different plant, using root tips.
Mitosis A) Observing Mitosis B) Time for Cell Replication
• What is your experimental hypothesis? Your null hypothesis? Are these the same? • How would you design an experiment with onion bulbs to test whether lectins increase the number of cells in mitosis? • What would you measure, and how would you measure it? • What would be an appropriate control for your experiment? Your teacher will provide you with untreated and lectin-exposed roots. You should be comfortable identifying cells in mitosis or in interphase before you begin examining the chromosome squashes.
Counting Cells and Analyzing Data 1. Observe the cells at high magnification (400–500 X). 2. Look for well-stained, distinct cells. 3. Within the field of view, count the cells in each phase. Repeat the counts in two other root tips. 4. Collect the class data for each group, and calculate the mean and standard deviation for each group. You must make a table in your notebook for the class data. 5. Compare the number of cells from each group in interphase and in mitosis. Check this website to learn the difference
Check this link to answer the following questions 1. For this experiment, the number of treated cells in interphase and mitosis will be the observed (o) values. Do the count and then we will do rest in class. 2. To find out what your expected values are, complete the following steps: a. Calculate the percentage of cells in interphase and mitosis in the control group from Table 1. b. Multiply the percentages by the total number of cells in the treated group; this will give the expected numbers (e). 3. Calculate the chi-square (χ2) value for the test. 4. Compare this value to the critical value in Table 2.
1. The degrees of freedom (df) equals the number of groups minus one. In this case, there are two groups, interphase and mitosis; therefore, df = 2-1, or 1. 2. The p value is 0.05, and the critical value is 3.84. If the calculated chi-square value is greater than or equal to this critical value, then the null hypothesis is rejected. If the calculated chi-square value is less than this critical value, the null hypothesis is not rejected. In terms of this part of the investigation, what does it mean if your null hypothesis is rejected?
Postlab Review • What was the importance of collecting the class data? • Was there a significant difference between the groups? • Did the fungal pathogen lectin increase the number of root tip cells in mitosis? • What other experiments should you perform to verify your findings? • Does an increased number of cells in mitosis mean that these cells are dividing faster than the cells in the roots with a lower number of cells in mitosis? • What other way could you determine how fast the rate of mitosis is occurring in root tips?
Part 3: Loss of Cell Cycle Control in Cancer Prelab Questions for Part 3 • How are normal cells and cancer cells different from each other? • What are the main causes of cancer? • What goes wrong during the cell cycle in cancer cells? • What makes some genes responsible for an increased risk of certain cancers? • Do you think that the chromosomes might be different between normal and cancer cells?
You have received a set of chromosomes to build your own karyotype. Follow all the instructions given on the handout! For each of the following cases, look at pictures of the chromosomes (karyotype) from normal human cells. Compare them to pictures of the chromosomes from cancer cells. For each case, count the number of chromosomes in each type of cell, and discuss their appearance. Then answer the following questions. • Do your observations support your hypothesis? • If not, what type of information might you need to know in order to understand your observations? • If yes, what type of information can you find that would validate your conclusions? Abnormal Karyotypes
Case 1: HeLa cellsCase 2: Philadelphia Chromosomes For each of the following cases, look at pictures of the chromosomes (karyotype) from normal human cells. Compare them to pictures of the chromosomes from cancer cells. For each case, count the number of chromosomes in each type of cell, and discuss their appearance. Then answer the questions in your lab textbook for this section.
Part 4Modeling Meiosis You will receive a set of chromosomes to review chromosome duplication and movement using these model chromosomes.
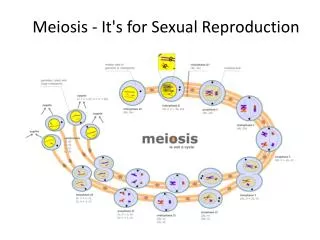
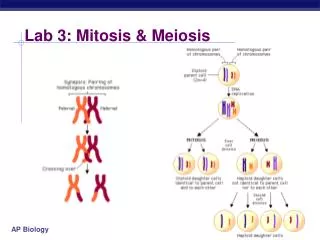
How do sexually reproducing organisms produce gametes from diploid progenitors? How does the process increase gamete diversity? What are the outcomes from independent assortment and crossing over? How does the distance between two genes or a gene and a centromere affect crossover frequencies? Part 4: Simulation of Meiosis
e) When is the DNA replicated during meiosis? f) Are homologous pairs of chromosomes exact copies of each other? g) What is crossing over? h) What physical constraints control crossover frequencies? i) What is meant by independent assortment? j) How can you calculate the possible number of different kinds of gametes? k) What happens if a homologous pair of chromosomes fails to separate, and how might this contribute to genetic disorders such as Down syndrome and cri du chat syndrome? l) How are mitosis and meiosis fundamentally different?
Meiosis Lab Part 5: Crossing Over During Meiosis
Meiosis Lab Sordaria fimicola growing on a potato dextrose agar plate.
Sordaria Culture Plate • To observe crossing over in Sordaria fimicola, an ascomycete fungus , one must make hybrids between wild-type and mutant strains of Sordaria. • Wild-type (+) Sordaria have black ascospores. One mutant strain has tan spores (tn). • When mycelia of these two different strains come together and undergo meiosis, the asci that develop will contain four black ascospores and four tan ascospores.
The arrangement of the spores directly reflects whether or not crossing over has occurred.
Instructions Part 5: Crossing Over During Meiosis
A cross was made between wild type (+; black) and tan (tn) strains. The resulting zygote produces either parental type asci, which have four black and four tan spores in a row (4:4 pattern), or recombinant asci, which do not have this pattern.
• How do you explain the differences between the recombinant asci and the parental types? • What meiotic event can account for this difference? • Using the model chromosomes from Part 4, predict the possible meiotic outcomes.
Meiosis Crossing over during Meiosis in Sordaria
INSTRUCTIONS 1. Count at least 50 asci, and score them as either parental or recombinant (crossing over). 2. Enter the data in Table 3 and make the calculations. One map unit equals one recombinant per 100 total events. The percentage of asci showing crossover divided by 2 equals the map units in this activity. This is done because each spore produced by meiosis undergoes a mitotic division.
Mitosis and Meiosis Crossing over during Meiosis in Sordaria
The slides in this presentation show the arrangement of ascospores in Sordaria after using the squash technique to burst the perithecia. • Properly squashed perithecia will eject their asci in a radial arrangement, like the spokes of a wheel. In collecting data it is best to start at one point, systematically moving in a clockwise or counterclockwise fashion, classifying each ascus that can be clearly seen until a full circle has been completed. You will need to focus carefully to see all the spores in an ascus. Note that the ascus narrows on the end that connects it to the fungal mycelium. Locating the narrowed, broken end will allow you to properly classify any isolated asci that may be found on your slides. • Total your results from crossover slides 1-9. Compare your results with another lab group.
Mitosis and Meiosis Crossing over during Meiosis in Sordaria Why do we divide the % by 2?
Meiosis Crossing over happened between these two chromatids…
Crossing over happened between these two chromatids…but not between these two so it only happened ½ the time.