Download
1 / 41
410 likes | 496 Views
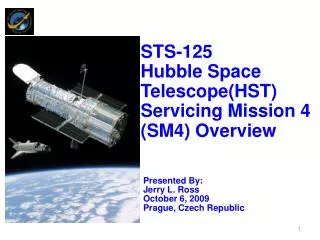
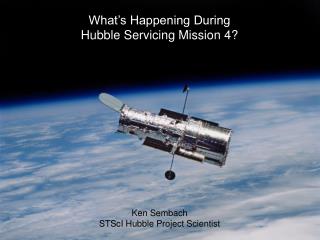
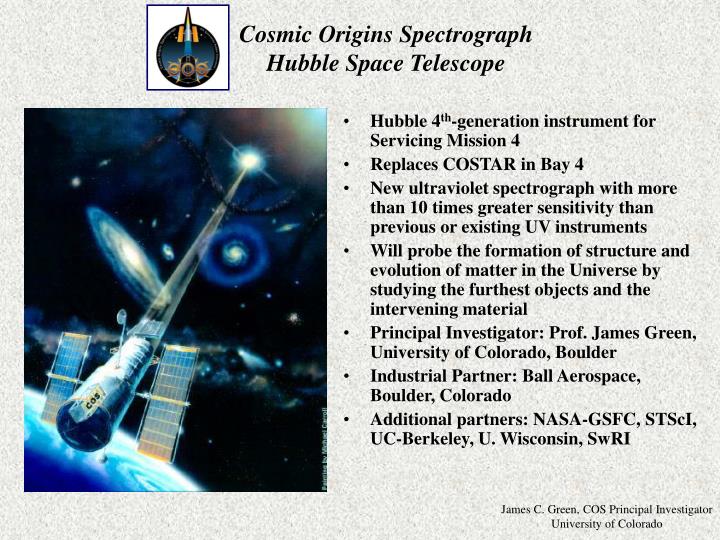
Hubble 4 th -generation instrument for Servicing Mission 4 Replaces COSTAR in Bay 4 New ultraviolet spectrograph with more than 10 times greater sensitivity than previous or existing UV instruments

E N D
Hubble 4th-generation instrument for Servicing Mission 4 • Replaces COSTAR in Bay 4 • New ultraviolet spectrograph with more than 10 times greater sensitivity than previous or existing UV instruments • Will probe the formation of structure and evolution of matter in the Universe by studying the furthest objects and the intervening material • Principal Investigator: Prof. James Green, University of Colorado, Boulder • Industrial Partner: Ball Aerospace, Boulder, Colorado • Additional partners: NASA-GSFC, STScI, UC-Berkeley, U. Wisconsin, SwRI
Instrument Rationale and Philosophy • The HST & Beyond (Dressler) Committee (May 1996) emphasized the uniqueness of HST for conducting UV studies during this decade and that HST “should have excellent, unprecedented UV capability for imaging and spectroscopy, capabilities completely unavailable from the ground or from space with such a large collecting area.” • COS was designed to maximize sensitivity for medium-resolution (R~20,000) spectroscopy • “Break the 1 × 10-14 ergs/cm2/s/Å flux barrier” • SM4 instrumentation AO released December 1996 • COS proposal submitted for peer review April 1997 • COS selected in August 1997 • HST Project requested addition of NUV channel using STIS spare MAMA Band 2 detector during Fall 1997 • COS Critical Design Review April 2000 • COS Complete: November 2003
“Spectroscopy lies at the heart of astrophysical inference.” COS Science Themes What is the large-scale structure of matter in the Universe? How did galaxies form out of the intergalactic medium? How were the chemical elements for life created in massive stars and supernovae? How do stars and planetary systems form from dust grains in molecular clouds in the Milky Way? What are planetary atmospheres and comets in our Solar System made of?
NUV MAMA Detector (STIS spare) Calibration Platform OSM2: G185M, G225M, G285M, G230L, TA1 FUV XDL Detector • COS has 2 channels to provide low and medium resolution UV spectroscopy • FUV: 1150-1775Å, NUV: 1700-3200Å • FUV gratings: G130M, G160M, G140L • NUV gratings: G185M, G225M, G285M, G230L • M gratings have spectral resolution of R ~ 20,000 Aperture Mechanism: Primary Science Aperture, Bright Object Aperture OSM1: G130M, G160M, G140L, NCM1 Optical bench (not shown): re-use of GHRS bench
The aberrated HST PSF centered in the COS Primary Science Aperture. Target Acquisition • COS is a “slitless” spectrograph, so the precision of target acquisition (placement of target relative to calibration aperture) is the largest uncertainty for determining the absolute wavelength scale. • Goal is to center targets routinely in science apertures to a precision of • +/- 0.1 arcsec (= +/- 10 km/s). • Throughput is relatively insensitive to centering due to large size of science apertures; centering of +/- 0.3 arcsec necessary for >98% slit throughput.
COS FUV Spectroscopic Modes Nominal Wavelength Resolving Power Grating Wavelength Range (R = l/Dl) b Coverage a per Exposure G130M 1150 - 1450 Å 300 Å 20,000 - 24,000 G160M 1405 - 1775 Å 375 Å 20,000 - 24,000 G140L 1230 - 2050 Å > 820 Å 2400 - 3500 a Nominal Wavelength Coverage is the expected usable spectral range delivered by each grating mode. The G140L grating disperses the 100 - 1100 Å region onto one FUV detector segment and 1230 - 2400 Å onto the other. The sensitivity to wavelengths longer than 2050 Å or shorter than 1150 Å will be very low. b The lower values of the Resolving Power shown are delivered at the shortest wavelengths covered, and the higher values at longer wavelengths. The resolution increases roughly linearly between the short and long wavelengths covered by each grating mode.
COS NUV Spectroscopic Modes Nominal Wavelength Resolving Power Grating Wavelength Range (R = l/Dl) b Coverage a per Exposure G185M 1700 - 2100 Å 3 x 35 Å 16,000 - 20,000 G225M 2100 - 2500 Å 3 x 35 Å 20,000 - 24,000 G285M 2500 - 3200 Å 3 x 41 Å 20,000 - 24,000 G230L 1700 - 3200 Å (1 or 2) x 400 Å 1500 - 2800 a Nominal Wavelength Coverage is the expected usable spectral range delivered by each grating mode, in three non-contiguous strips for the medium-resolution modes. The G230L grating disperses the 1st-order spectrum between 1700 - 3200 Å along the middle strip on the NUV detector. G230L also disperses the 400 - 1400 Å region onto one of the outer spectral strips and the 3400 - 4400 Å region onto the other. The shorter wavelengths will be blocked by an order separation filter and the longer will have low thruput on the solar blind detector. The G230L 2nd-order spectrum between 1700 - 2200 Å will be detected along the long wavelength strip. b The lower values of the Resolving Power shown are delivered at the shortest wavelengths covered, and the higher values at longer wavelengths. The resolution increases roughly linearly between the short and long wavelengths covered by each grating mode.
For Comparison - COS Throughputs: STIS (no slit loss)G130M @ 1216 Å (peak) = 19.7%, @ 1430 Å = 9.0% @1216 A = 0.7% E140M G160M @ 1430 Å = 11.7%, @ 1669 Å = 5.8% @1669 Å = 0.15% E140M G140L @ 1248 Å = 10.7%, @ 1723 Å = 0.65%G185M @ 1777 Å = 3.9%, @ 2085 Å = 2.3%G225M @ 2262 Å = 2.7%, @ 2497 Å = 2.8% @2500 A = 0.8% E230MG285M @ 2659 Å = 2.2%, @ 2998 Å = 1.0%G230L @ 1846 Å = 3.0%, @ 2998 Å = 0.8%
Point source Spectra Calibration Stripes NCM3a NCM3a NCM3b NCM3c NCM3b NCM3c Increasing Wavelength 25.60 square 1.45 5.75 2.25 4.95 2.80 2.80 All dimensions in mm • NUV spectra projected onto the NUV MAMA detector
Single grating tilt yields 3 stripes Resolution R ~ 20,000 * NUV G285M PtNe Wavecal Spectra - N2 Purge Data
Resolution ~ 1.2 Å Wavelength (Å) Three grating tilts required to cover the full range shown * NUV G230L PtNe Wavecal Spectra - N2 Purge Data
COS and STIS Observing modes
COS Imaging Plate scale = 0.024″ / pixel FWHM resolution (radial) 2.7 pixels = 0.064″ (FWHM is ~ 78% encircled energy) Field of View = 2.5″ - 3″ (fuzzy edge) (40 resol diameter - 105 pixel diameter image) For comparison, ACS WFC/HRC has 80/82% encircled energy in 0.25″ @ 6328 Å
COS Flat Fielding • FUV detector show hex pattern consistent with MCP manufacturing process – • Stable geometric distortion map can be developed and applied • Classic flat field techniques applied at the illuminated averaged pixel level have allowed S/N = 70 data (limited by statistics)
Tag Flash • The grating select mechanism exhibits very small drifts after movement – which can degrade spectral resolution and wavelength accuracy. • This can be addressed by flashing the cal lamps during a science exposure to track the drift.
Quasar Absorption Lines trace the “Cosmic Web” of material between the galaxies • COS will study: • Large-scale structure by tracing Hydrogen Lyman a absorptions • Formation of galaxies • Chemical evolution of galaxies and the intergalactic medium • Hot stars and the interstellar • medium of the Milky Way • Supernovae, supernova remnants and the origin of the elements • Young Stellar Objects and the • formation of stars and planets • Planetary atmospheres in the Solar System • Visualization concept from Schiminovich & Martin • Numerical simulation from Cen & Ostriker (1998) • Songaila et al. (1995) Keck spectrum adapted by Lindler & Heap
1. Large-scale structure, the IGM, and the origin of the elements • Comparison of Chandra, HST-STIS, and FUSE spectra of an absorber along the sight-line to PKS2155-304 (from Shull et al. 2003, Fang et al. 2002). COS will obtain complementary spectra toward the ~150 QSO sight-lines observed by FUSE where O VI absorption has been detected. COS will extend the characterization of Lya absorbers and associated metal lines to higher redshifts for measuring abundances and metal production rates. • STIS G140M spectrum (resolution ~ 19 km/s) from Penton et al. (2001) showing low-redshift • intergalactic Lyman a absorbers along the sight-line to QSO TON-S180, including a pair of Lya pairs. Significantly lower resolution would mistake the “pair of Lya pairs” as just two broad components, leading to over-estimates of the gas temperature and under-estimates of the true H I column density.
1. Large-scale structure, the IGM, and the origin of the elements • The Lyman a Forest • conduct baryon census of the IGM • derive space density, column density distribution, Doppler widths, and two-point correlation functions • test association with galaxies and consistency with models of large-scale structure formation and evolution • tomographic mapping of cloud sizes and structure, requiring multiple nearby QSO sight-lines • From Stocke (1997)
The distribution of the frequency, dN/dz, of strong and weak Lyman a absorbers with redshift (from Shull et al. 2001). Strong absorbers (log NHI> 14) were studied in the UV with FOS at low spectral resolution, but virtually nothing is known about the distribution of the far more numerous weak absorbers at far-UV and near-UV wavelengths. • High signal-to-noise COS UV spectra are needed to determine the distribution of weak absorbers (log NHI 13) over the redshift range z = 0.1 - 1.6. HST-COS to come HST-FOS results Ground-based results
1. Large-scale structure, the IGM, and the origin of the elements • He II and H I absorption toward HE2347-4342 (from • Shull et al. 2003). The high He II opacities indicate that the • epoch of reionization of He is significantly delayed from that • of H. • He II Gunn-Peterson effect • trace the epoch of reionization via redshifted He II Ly a (l304 Å) absorption in low-density IGM at redshifts z > 2.8 • determine whether He II absorption is discrete or continuous • allows estimates of “ionization correction” in order to count baryons in the IGM • allows estimate of flux and spectral shape of background ionizing radiation from quasars and starbursts
1. Large-scale structure, the IGM, and origin of the elements • Origin of the elements • measure the primordial D/H to test Big Bang nucleosynthesis • track evolution of D/H with redshift and metallicity • track star formation rate and heavy element abundances with redshift
2. Formation, evolution, and ages of galaxies • From Leitherer (1997) • QSO sight-lines will probe hot gas associated with galaxy halos • measure abundances in halos and energy content of gaseous outflows • study interface between halos and IGM • connect abundances to star formation rates and feedback to galaxies • Origin of young stellar systems and the heavy elements • local counterparts to high-z star forming galaxies • the violent ISM of starburst galaxies • nucleosynthesis in ejecta-dominated supernova remnants • N132D • in the LMC • From Morse et al. (1996)
3. Stellar and planetary origins and the cold interstellar medium • Cold gas in the interstellar medium • physics and chemistry of translucent clouds • measure gas-phase atomic and molecular abundances in the regime where gas is predominantly molecular, dust grains accrete icy mantles, and the first steps in the condensation process, ultimately leading to star formation • determine ubiquity of PAHs in the ISM and molecular clouds • measure UV extinction toward highly reddened stars • Measure diagnostics of accretion shocks in YSOs • From Snow (1997)