Download
1 / 26
260 likes | 404 Views
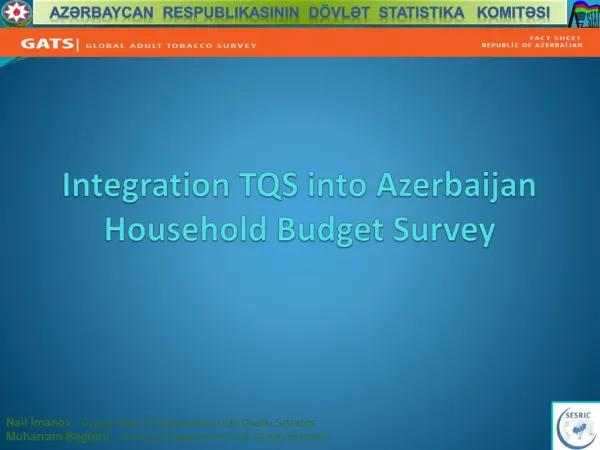
POVERTY MEASUREMENT AND METODOLOGY OF HOUSEHOLD BUDGET SURVEY IN AZERBAIJAN. Yashar PASHA. Demographical situation. Territory – 86,6 square km ; Number of population – 9356500 ; Number of households – 1 895941 Average size of households – 4, 7

E N D
POVERTY MEASUREMENT AND METODOLOGY OF HOUSEHOLD BUDGET SURVEY IN AZERBAIJAN Yashar PASHA
Demographical situation • Territory – 86,6 squarekm; • Number of population – 9356500; • Number of households – 1895941 • Average sizeof households – 4,7 • Population density – 96; (per 1 km2) • urbanpopulation – 54per cent; • ruralpopulation – 46per cent; • men – 49 per cent; • women – 51 per cent; Population by age group: • 0-14 years – 26 per cent; • 15-64 years – 67 per cent; • 65 years and older – 7 per cent;
Demographical situation • Per 1000 person of population: birthsrate – 16; deathsrate – 6; natural increase – 10; marriages – 8; divorces – 1; • Per 1000 of born: infant mortality children up to 12 months – 10 children up to 5 years – 15; maternal mortality – 26 (for 10000 of born)
Demographical situation • Literacy – 98.8%; men – 99.5%; women – 98.2% • Lifeexpectancy – 72.4 years formen – 69.6 years forwomen – 75.2 years • Numberofrefugees&IDPs– 1 millionpersons; • Capital – Baku city numberofresidentpopulation – 1 million 855 thousandspersons
Definition of poverty and social exclusions adopted by the Council of Europe in 1984: “…poor are those persons, families and groups of persons whose resources (material, cultural and social) are so limited as to exclude them from the minimum acceptable way of life in the state to which they belong…” Definition of poverty adopted in Azerbaijan in 2001:“Poverty is an impossibility due to a lack of funds to keep up to the living style inherent in a specific society in a specific period of time”
Approaches to defining poverty criteria Monetary Non-monetary Relative Absolute Income-based Consumption-based Objective Subjective Most researchers recognize that a combined use of several different approaches is the most effective way to measure such a complex and multifaceted phenomenon as poverty.
Approaches to defining a poverty line for international comparisons monetary – minimum funds required for survival, per day consumption-based – minimum dietary energy intake or quantity of microelements in daily food consumption structural – maximum percentage of household expenditures for food in the total household expenditures relative criteria deprivations
Sampling Procedurefor HBS • Used territorially-random sampling • For sample uses three-stage probability sampling with preliminary stratification. The population census data were gathered using the following administrative units: the population census districts, supervisor site and enumerator unit. The census districts are used as the primary sampling units (PSUs), with the population census supervisor areas as the secondary sampling units (SSUs), and with households as the ultimate sampling units
Sampling Procedurefor HBS • Data from the 2009 population census had been entered and stored by following structure: code of districts and census district, supervisor site, enumerator unit,surname, name head of households, number of person, full address and mail index
Sampling Procedurefor HBS • The secondary sampling units were formed using maps of the population census territories, the population census data on number of households living within each of these territories. Within each primary sampling unit in rural areas selected at the first stage, one secondary sampling unit per interviewer was selected, using systematic probability proportional to size sampling. In order to spread out to a greater extent the sample within each primary sampling unit of urban areas, two secondary sampling units per interviewer were selected using systematic probability proportional to size sampling.
Second stage sampling • As a rule the population census supervisors’ areas were used as the secondary sampling units. Nevertheless some of population census supervisors’ areas were too spread out. For such territories each secondary sampling unit was formed using the population census maps as a amalgamation of some of population census enumerator areas. Thus more compact secondary sampling territories were created. The total number of secondary sampling units formed within 125 selected primary sampling units was equal to 493
Sampling of households • Selection of households for each interviewer is carried out within sampled secondary units using simple random sampling. Each interviewer every week approaches 2 households for the 2 weeks’ diary period. Thus the number of sampled households for each interviewer within one quarter is equal to 26. 13 different weeks. Since every household participates in the survey only during a one-quarter period the annual sample size for each interviewer is equal to 104 households.
Starting from January of 2008 quarterly panel survey • I quarter4250households • IIquarter4250households • IIIquarter4250households • IVquarter4250households • In annual data base 4250 households and18000 individuals
Survey Questionnaires: • Questionnaire for main interview. (is filled in the beginning of survey for every household); • Expenses journal. (is filled by every household during 2 weeks of a quarter); • Quarter questionnaire of incomes and expenses. (is filled at the end of survey for every household by all persons involved). • Instruction for a quarter questionnaire. (utilized while a quarter questionnaire of incomes and expenses is being filled);
Received Results are Grouped: • By types of households • By education, sex, age, employment, social status of a household.s head • By decile and quintil groups of population • By level of income and expenses of families with/without children
AssessmentofthetotalofmonetaryincomesbyquintilgroupsofpopulationAssessmentofthetotalofmonetaryincomesbyquintilgroupsofpopulation • I quintil 12.4 % • II quintil 16.0 % • III quintil 18.6 % • IV quintil 21.6 % • V quintil 31.4 % • The disparity between 10% of the most and the least wealthy groups of population is 3.3 times
Ration of Refugee and IDP childrens • 8.3 % of refugees. children aged between 12 months and 6 years are considered as underfed. • In this category children of 5 years have the highest percentage of children with insufficient weight, boys . 10.7 %, girls . 7.5 %
PovertyLevel, 2012 • Absolutepoverty – 137$ (consumersexpendituremedian) • isbasedinthesizeofaminimumconsumption basketthatincludes2400 kcalperday • specificgravityoffoodstuffinaminimum consumptionbasketisequalto59% • Relativepoverty – 78$ (60 % ofconsumersexpendituremedianpercapita) • definespovertylevelinthepoorestgroupsof population
Poverty line • The Law on living wage (minimum consumption budget) was adopted by Cabinet of the Ministers in 2005 according to which per capita basket of goods per year is calculated by normative-statistical method as well as by able-bodied population, pensioners, and children under 15 years old.
Consumption of food products by main products groups, annual, kg.
Chemical structure, calories of consumed foods, per capita, per day.
Thanks! www.stat.gov.az yashar@azstat.org