Download
1 / 49
620 likes | 1.26k Views
Advanced Topics in Risk Management. Learning objectives: Explain the meaning of financial risk management and enterprise risk management. Describe the impact of the underwriting cycle and consolidation in the insurance industry on the practice of risk management.

E N D
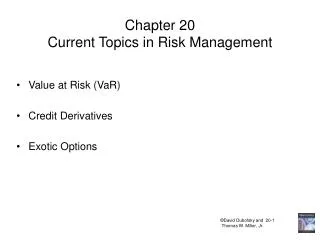
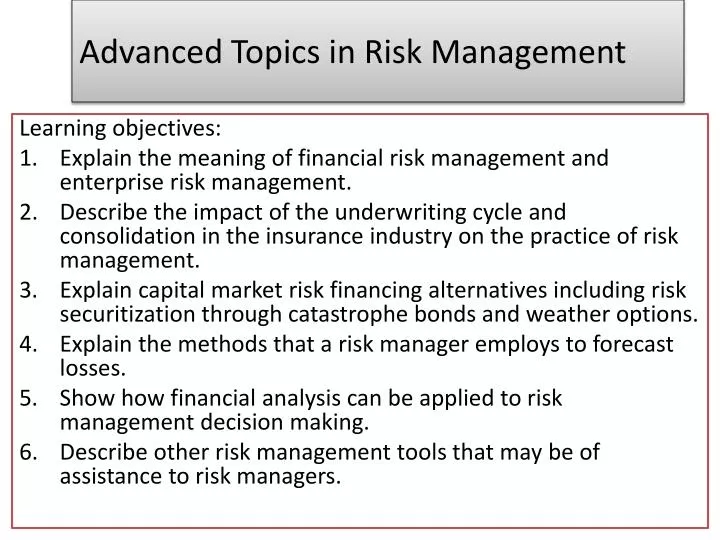
Advanced Topics in Risk Management Learning objectives: Explain the meaning of financial risk management and enterprise risk management. Describe the impact of the underwriting cycle and consolidation in the insurance industry on the practice of risk management. Explain capital market risk financing alternatives including risk securitization through catastrophe bonds and weather options. Explain the methods that a risk manager employs to forecast losses. Show how financial analysis can be applied to risk management decision making. Describe other risk management tools that may be of assistance to risk managers.
Financial risk management: refers to the identification, analysis, and treatment of speculative financial risks. It includes the following: • Commodity price risk: the risk of losing money if the price of a commodity changes. - producers and users of commodities face commodity price risks. - users and distributors of commodities face commodity price risks.
Examples: • Consider an agricultural operation that will have thousands of bushels of grain at harvest time. At harvest, the price of the commodity may have increased or decreased, depending on the supply and demand for grain. Because little storage is available for the crop, the grain must be sold at the current market price, even if that price is low. • Consider a cereal company that has promised to deliver 500,000 boxes of cereal at an agreed-upon price in six months. In the meantime, the price of grain – a commodity needed to produce cereal – may increase or decrease, altering the profitability of the transaction.
2. Interest rate risk: the risk of loss by adverse interest rate movements. Ex: a. Consider a bank that has loaned money at fixed interest rates to home purchasers under 15 and 30 year mortgages. If interest rates increase, the bank must pay higher interest rates on deposits while mortgages are locked-in at lower interest rates.
3. Currency exchange rate risk: the risk of loss of value caused by changes in the rate at which one nation’s currency may be converted to another nation’s currency.
Managing Financial Risks: Pure risks: handled by the risk manager through risk retention, risk transfer, and loss control. Speculative risks: handled by the finance division through contractual provisions and capital market instruments. Integrated risk program: a risk treatment technique that combines coverage for pure and speculative risks faced by the organization. A double-trigger option : a provision that provides for payment only if two specified losses occur. Payments would be made only if a large property claim and a large exchange rate loss occurred.
Enterprise risk management: a comprehensive risk management program that addresses an organization’s pure risks, speculative risks, strategic risks, and operational risks. Strategic risk: refers to uncertainty regarding an organization’s goals and objectives, and the organization’s strengths, weaknesses, opportunities, and threats. Operational risks: develop out of business operations, including the manufacture and distribution of products and providing services to customers.
Insurance Market Dynamics: • When property and liability loss exposures are not eliminated through risk avoidance, losses that occur must be financed in some other way. • The risk manager must choose between two methods of funding losses: • risk retention • risk transfer • Retained losses can be paid out of current earnings, from loss reserves, by borrowing , or by captive insurance company. • Risk transfer shifts the burden of paying for losses to another party, most often a property and liability insurance company. • Decisions about whether to retain risks or to transfer them are influenced by conditions in the insurance market place.
Factors influencing the insurance market: 1) Underwriting cycle: the cyclical pattern in underwriting stringency, premium levels, and profitability. 2) Hard insurance market: property and liability insurance markets fluctuate between periods of tight underwriting standards and high premiums. 3) Soft insurance market: periods of loose underwriting standards and low premiums.
4) Combined ratio for the property and liability insurance industry over time: Combined ratio: is the ratio of paid losses and loss adjustment expenses plus underwriting expenses to premiums. If the combined ratio is greater than 1 (or 100%), underwriting operations are unprofitable.
Factors that affect property and liability insurance pricing and underwriting decisions: • Insurance industry capacity: refers to the relative level of surplus. Surplus: the difference between an insurer’s assets and its liabilities. With strong surplus position, insurers can reduce premiums and loosen underwriting standards.
External factors (such as earthquakes), may increase the level of claims, reducing surplus. The 9/11 attacks produced a clash loss in the insurance industry. Clash loss: occurs when several lines of insurance simultaneously experience large losses.
2. Investment returns: Insurance companies are in two businesses: a. underwriting risks b. investing premiums Cash flow underwriting: selling of insurance coverage at lower premium rates, hoping to offset underwriting losses with investment income.
Consolidation in the Insurance Industry: Consolidation: the combining of business organizations through mergers and acquisitions. Consolidation trends in the insurance marketplace: • Insurance company mergers and acquisitions / Insurance brokerage mergers and acquisitions: Insurance brokers : are intermediaries who represent insurance purchasers. b. Cross-Industry Consolidation:
Capital Market Risk Financing Activities: • Securitization of Risk: means that the insurable risk is transferred to the capital markets through creation of a financial instrument, such as catastrophe bond, futures contract, options contract, or other financial instrument. • The impact upon the insurance marketplace is an immediate increase in capacity for insurers and reinsurers. • Provides access to the capital of many investors. Catastrophe bonds : are corporate bonds that permit the issuer to skip or defer scheduled payments if a catastrophe loss occurs.
2. Insurance Options: an option that derives value from specific insurable losses or from an index of values. • Profitability of business is determined by weather conditions. • Utility companies, farmers, ski resorts face weather-related risk and uncertainty. Weather option: provides payment if a specified weather contingency occurs.
Loss Forecasting: Techniques in predicting loss levels: • Probability analysis: • Chance of loss is the possibility that an adverse event will occur. • The probability (P) of such an event is equal to the number of events likely to occur (X) divided by the number of exposure units (N). P (physical damage) = X / N
Ex: If a vehicle fleet has 500 vehicles and on average 100 vehicles suffer physical damage each year, the probability that a fleet vehicle will be damaged in any given year is: P = X / N = number of events likely to occur number of exposures = 100 / 500 = 20%
Independent events: the occurrence does not affect the occurrence of another event. Ex: Assume that a business has production facilities in Louisiana and Virginia, and that the probability of a fire at the Louisiana plant is 5% and the probability of fire at the Virginia plant is 4%. The occurrence of one of these events does not influence the occurrence of the other event. If events are independent, the probability that they will occur together is the product of the individual probabilities. The probability that both production facilities will be damaged is: P (fire at L) X P (fire at V) = P (fir at both plants) = 0.04 x 0.05 = 0.002 or 0.2%
Dependent events: the occurrence of one event affects the occurrence of the other. If two buildings are located close together, and one building catches on fire, the probability that the other building will burn is increased. Ex: Suppose that the individual probability of a fire loss at each building is 3 percent. The probability that the second building will have a fire given that the first building has a fire, may be 40%. What is the probability of two fires? This probability is a conditional probability that is equal to the probability of the first event multiplied by the probability of the second event, given the first event has occurred: P (fire on one bldg.) x P (fire at 2nd bldg. given fire at 1stbldg) = P ( both burn) 0.03 x 0.40 = 0.012 or 1.20%
Events are “mutually exclusive” if the occurrence of one event precludes the occurrence of the second event. Ex: If a building is destroyed by fire, it cannot also be destroyed by flood. Mutually exclusive probabilities are additive. If the probability that a building will be destroyed by fire is 2% and the probability that the building will be destroyed by flood is 1%, then the probability the building will be destroyed by either fire or flood is: P (fire destroys bldg.) + P(flood destroys bldg.) = P (fire or flood destroys bldg.) .02 + .01 = .03 or 3 %
If the independent events are not mutually exclusive, then more than one event could occur. Ex: If the probability of minor fire damage is 4% and the probability of minor flood damage is 3%, then the probability of at least one of these events occurring is: P(minor fire) + P(minor flood) – P(minor fire and flood) = P(at least one event) .04 + .03 - ( .04 x .03 ) = 0.0688 or 6.88%
Assigning probabilities to individual and joint events and analyzing the probabilities can assist the risk manager in formulating a risk treatment plan.
Loss Forecasting Techniques: cont’d 2. Regression Analysis: characterizes the relationship between two or more variables and then uses this characterization to predict values of a variable. One variable – the dependent variable – is hypothesized to be a function of one or more independent variables.
Exhibit 1: Provides the data for a company’s annual payroll in thousands of dollars and the corresponding number of workers compensation claims during the year. Relationship Between Payroll and Number od Workers Compensation Claims:
Hypothesized relationship: Number of workers compensation Claims = Bo + (B1 x Payroll) Where: Bo is a constant B1 is the coefficient of the independent variable. Regression results: Y = -6.1413 + .1074 X R² = .9519 Predicted number of claims next year, if the payroll is $ 4.8 million: Y = - 6.1413 + ( .1074 x 4800) Y = 509.38 Coefficient of determination, R² ranges from 0 to 1 measures the model fit. R-square value close to 1 indicates that the model does a good job in predicting Y values. The risk manager estimates that 509 workers compensation claims will occur in the next year.
3. Forecasting Based on Loss Distributions: Loss distribution : a probability distribution of losses that could occur. - Works well if losses tend to follow a specified distribution and the sample size is large.
Financial Analysis in Risk Management Decision Making: • The time value of money: means that when valuing cash flows in different time periods, the interest-earning capacity of money must be taken into consideration. A dollar received today is worth more than a dollar received one year from today, because the dollar received today can be invested immediately to earn interest.
Ex: Suppose you open a bank account today and deposit $100. The value of the account today- the present value – is $100. Further assume that the bank is willing to pay 4% interest, compounded annually, on your account. What is the account balance one year from today? Future Value: FV = PV x (1 + i) FV = $100 x (1 + .04) = $104 or $100 + ($100 x .04) = $ 104
Account Balance after 2 years: (Future value of the present amount): PV (1 + i )ᵑ = FV where n is the number of time periods Compounding: the operation through which a present value is converted to a future value. (earning interest on interest: compound interest)
Compounding also works in reverse: Ex: Assume that you know the value of a future cash flow, but you want to know what he cash flow is worth today, adjusting for the time value of money. Divide both sides of the compounding equation by (1 + I )ᵑ yields the following expression: PV = FV / (1 + I ) ᵑ Discounting : the operation of bringing a future value back to present value.
Financial Analysis Applications: • Analyzing Insurance Coverage Bids: Assume that risk manager would purchase property insurance on a building. She is analyzing two insurance coverage bids. The bids are from comparable insurance companies, and the coverage amounts are the same. The premiums and deductibles differ. Insurer A’s coverage requires an annual premium of $90,000 with a $5000 per claim deductible. Insure B’s coverage requires an annual premium of $35,000 with a $10,000 per-claim deductible. The risk manager wonders whether the additional $55,000 in premiums is warranted to obtain the lower deductible. Using some of the loss forecasting methods, the risk manager predicts the following losses will occur:
Which coverage bid should be selected, based on the number of expected claims and the magnitude of these claims? --------------------------------------------------- Assume the premiums are paid at the start of the year, losses and deductibles are paid at the end of the year, and 5 percent is the appropriate interest (discount ) rate.
Insurer A’s bid: Expected cash flows in one year would be the first $5000 of 20 losses that are each $5000 or more, for a total of $100,000 in deductibles. Present value of these payments: PV = 100,000 / (1 + 0.05)ᶦ = $95,238 The present value of the total expected payments ($90,000 insurance premium at the start of the year plus the present value of the deductibles) would be $185,238.
Insurer B’s bid: Expected cash outflows for deductibles at the end of the year : ($5000x12)+($10,000x6)+($10,000x2)=$140,000 The present value of these deductible payments is: PV = 140,000 / (1 + .05) ᶦ = $133,333 The present value of the total expected payments ($35,000 insurance premium at the start of the year plus the present value of the deductibles) would be $168,333. Because the present values calculated represent the present values of cash outflows, the risk manager should select the bid from Insurer B, because it minimizes the present value of the cash outflows.
2. Loss-Control Investment Decisions: Loss-control investments are undertaken in an effort to reduce the frequency and severity of losses. Such investments can be analyzed from a capital budgeting perspective by employing time value of money analysis. Capital budgeting : a method of determining which capital investment projects a company should undertake. Only those projects that benefit the organization financially should be accepted. If not enough capital is available to undertake all of the acceptable projects, then capital budgeting can assist the risk manager in determining the optimal set of projects to consider.
Capital Budgeting Techniques: • Net Present Value: the sum of the present values of the future net cash flows minus the cost of the project. To calculate the NPV, the cash flows are discounted at an interest rate that considers the rate of return required by the organization’s capital suppliers and the risk of the project. A positive net present value represents an increase in value for the firm. A negative net present value would decrease the value of the firm is the investment were made.
Ex: The risk manager of an oil company that owns service stations may notice a disturbing trend in premises-related liability claims. Patrons may claim to have been injured on the premises (slip-and-fall injuries near gas pumps or inside the service station) and sue the oil company for their injuries. The risk manager decides to install camera surveillance systems at several of the problem service stations at a cost of $85,000 per system. The risk manager expects each surveillance system to generate an after-tax net cash flow of $40,000 per year for three years. The present value of $40,000 per year for three years discounted at the appropriate interest rate (assume 8%) is $103,084.
NPV =PV of future cash flows – Cost of project = $103,000 - $85,000 = $ 18,084. As the project has a positive net present value, the investment is acceptable.
The project’s internal rate of return can be compared to the company’s required rate of return on investment. IRR : the interest rate that makes the net present value equal zero. When the IRR is used to discount the future cash flows back to time zero, the sum of the discounted cash flows is the cost of the project.
IRR = 19.44 percent , greater than the required rate of return, 8%, the project is acceptable. Future cash flows are estimates of the benefits that will be obtained by investing the project. Benefits may come in the form of increased revenues, decreased expenses, or a combination of the two. Although some revenues and expenses associated with the project are easy to quantify, other values such as employee morale, reduced pain and suffering, public perceptions of the company, and lost productivity when a new worker is hired to replace an injured experienced worker – can prove difficult to measure.
OTHER RISK MANAGEMENT TOOLS: • Risk Management Information Systems (RMS): • A computerized database that permits the risk manager to store and analyze risk management data and to use such data to predict and attempt to control future loss levels. 2. Risk Management Intranets: a private network with search capabilities designed for a limited, internal audience.
3. Risk Maps: grids detailing the potential frequency and severity of risks faced by the organization. 4. Value at risk (VAR) analysis: the worst probable loss likely to occur in a given time period under regular market conditions at some level of confidence. 5. Catastrophe modeling: a computer-assisted method of estimating losses that could occur as a result of a catastrophic event.
SUMMARY: Financial risk management is the identification, analysis, and treatment of speculative financial risks. Risks include commodity price risk, interest rate risk, and currency exchange rate risk. An Integrated risk program is a risk treatment technique that combines coverage for pure and speculative risks within the same contract. Enterprise risk management is a comprehensive risk management program that addresses an organization’s pure, speculative, strategic, and operational risks.
A cyclical pattern – called the “underwriting cycle” – has been observed in underwriting stringency, premium levels, and the profitability in the property and casualty insurance industry. In a “hard” insurance market, premiums are high and underwriting standards are tight. In a “soft” insurance market, premiums are low and underwriting standards are loose. Two important factors that affect property and casualty insurance company pricing and underwriting decisions are the level of capacity in the insurance industry and investment returns.
The insurance industry has been experiencing consolidation through insurance company mergers and acquisitions, insurance brokerage mergers and acquisitions, and cross-industry consolidation. Insurers, reinsurers are using capital market risk financing alternatives. These arrangements include: securitizing risk by issuing catastrophe bonds and insurance options. Risk managers can use a number of options to predict losses. These techniques include probability analysis, regression analysis, and forecasting by using loss distributions.
When analyzing events, the characteristics of the events must be considered. Events may be independent, dependent, or mutually exclusive. Regression analysis is a method of characterizing the relationship that exists between two or more variables and using the characteristics as a predictor. In analyzing cash flows in different periods, the time value of money must be considered. Changing a present value into a future value is called compounding, determining the present value of a future amount is called discounting.
Risk managers can apply time value of money analysis in many situations, including insurance coverage bid analysis and loss-control investment analysis. A risk management information system (RMIS) is a computerized database that permits risk managers to store and analyze risk management data and to use such data to predict future losses. Risk managers may use intranets, risk maps, value at risk (VAR) analysis, and catastrophe modeling in their risk management programs.