Download
1 / 17
170 likes | 291 Views
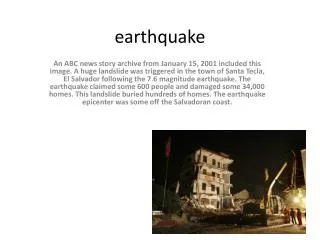
Earthquake Strength. Magnitude verses Intensity !. Magnitude. Is a measure of the amount of energy released from an earth quake . Recorded by the amplitude of the highest S wave There is only one magnitude for each earthquake – but we still use 3 seismograms to calculate it

E N D
Earthquake Strength Magnitude verses Intensity!
Magnitude • Is a measure of the amount of energy released from an earth quake. • Recorded by the amplitude of the highest S wave • There is only one magnitude for each earthquake – but we still use 3 seismograms to calculate it • Magnitude of earthquakes is measured by the Richter scale or Moment Magnitude
31.7 times more energy released and 10 times stronger for every unit increase on the Richter scale
Moment Magnitude • The measure of total energy released by an earthquake • Preferred by seismologists because it is more precise • Based on the area of the fault ruptured in the quake instead of just the epicenter • Calculated by multiplying the area of the fault’s rupture surface by the distance the earth moves along the fault • www.scsn.org/magnitude.html
Earthquake Intensity • A number describing the severity of an earthquake in terms of it’s effects on the earth’s surface, human beings, and structures such as buildings – Basically the impact the earthquake causes! • Measured by theMercalliScale
Warning Signs • Average temperature of the area keeps increasing – a few months prior to an earthquake • A sudden rise or fall in water levels • Seismo-electromagnetic precursor – (10-20 hours prior) geomagnetic field is reduced which affects radio, tv, telephone, and cell phones • Animals highly disturbed and restless • Sensitive patients may experience an increase in blood pressure, migranes, heart trouble
Seismic gaps • A zone along a tectonically active area where no earthquakes have occurred recently, but it is known that elastic strain is building in the rocks • If identified it might be an area expected to have a large earthquake in the future
Seismic Gap • In this illustration you can see areas of earthquake activity and an area of non activity – the area of non activity represents a “seismic gap” • Notice this is a subduction zone between two tectonic plates.
The Gap Hypothesis • Parts of active faults that have had relatively few earthquakes are likely to be the sites of strong earthquakes!
San francisco Bay Area • A major seismic gap area of interest to scientists in the United States
Assignment • Mercalli Scale/isoseismic map activity