Download
1 / 55
560 likes | 786 Views
Understanding Program Resource Management through Earned Value Analysis. “ Reading the Abba Charts” Wayne Abba PMI WDC Tool Time, July 18, 2006. Abba Consulting. Agenda. Earned Value Management and Resource Management Essential Data Elements and Graphics Earned Value Analysis

E N D
Understanding Program Resource Management through Earned Value Analysis “Reading the Abba Charts” Wayne Abba PMI WDC Tool Time, July 18, 2006 Abba Consulting
Agenda • Earned Value Management and Resource Management • Essential Data Elements and Graphics • Earned Value Analysis • EVA Scenarios • EVA and Funding Status • Baseline Management • Summary
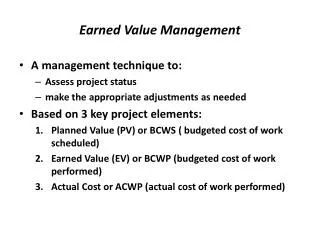
Resource Management • Earned Value Management = Resource Management • Resources are labor, material and other direct and indirect costs required to execute the program • FAA applies EVM at Program level to include prime and subcontractors, government FTEs, support contractors • Managed in dollars, hours, or any measurable unit • Cost and schedule data summarized directly from contracts and programs for management and reporting at all levels
Budgeted Cost for Work Scheduled Budgeted Cost for WorkPerformed Actual Cost of WorkPerformed - Approved baseline time-phased plan for resources to be consumed (e.g. 100 hours) - Work accomplished in terms of planned resources(e.g. 100 hours) - Actual cost of the resources consumed(e.g. 120 hours) - Reconcilable to accounting system EVM Terminology and Resource Management Assume basic understanding – Earned Value Management Concept and Terminology
Agenda • Earned Value Management and Resource Management • Essential Data Elements and Graphics • Earned Value Analysis • EVA Scenarios • EVA and Funding Status • Baseline Management • Summary
At Complete Variance Risk Schedule Slip J M J A A J EVM Trend Analysis: Cumulative Time Now Prog Budget Management Reserve ACWP (Actual Cost) Resources BCWS (Planned Value) Cost Variance 400 Schedule Variance BCWP (Earned Value) 300 200 100 Time ▲ M F Approx. Time Variance
Management Reserve EVM Trend Analysis:Cost/Schedule Variances ManagementReserveConsumption $ Favorable Schedule Variance at Completion 0 $ Unfavorable Cost Variance at Completion Time Schedule Slip Cost Variance --- Schedule Variance
Agenda • Earned Value Management and Resource Management • Essential Data Elements and Graphics • Earned Value Analysis • EVA Scenarios • EVA and Funding Status • Baseline Management • Summary
A-10 A-12 B-1 B-2 C-17 DDG-51 F-18 F-22 C-130H & J Chinook Apache Longbow Blackhawk Kiowa Seahawk Comanche T-45 T-46 CVN-68 SSN-21 SSN-688 SSN-774 T-AOE-6 LHD-1 Crusader M1 M2/M3 FVS MK-48 ADCAP MK-50 ALWT SSBN-726 CG-47 MH-53 V-22 Osprey P-3 Orion RCAS LIF Hawk DoD Experience • B-1 Engines • F-414-GE-400 Engines • Chem. Demilitirization • D-5 TRIDENT II • Javelin • Pershing II • FAMECE/UET • Satellites • AN/BSY-2 • THAAD • ABL • GBL • * Aggregate overrun 5.5% on 115 largest DoD contracts ($3.0B on $84.8B @ 60% complete), adjusted for over target baselines a/o 4/30/2000 * OUSD(AT&L)ARA/AM, 1/16/01
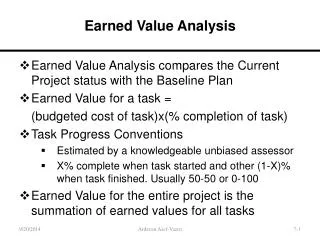
Earned Value Analysis • Earned Value Analysis = Understanding the relationships among the EVM data elements • EVM discipline provides confidence • Contractor and PM management systems are adequate • Data are summarized from the Control Account level, where technical/schedule/cost integration occurs • Use the data for management and oversight • Data quality becomes “self-policing” • Ask questions – be an informed, critical consumer
J Planned Resource Consumption Program Budget $M 40 Management Reserve 35 30 25 Resources BCWS (Planned Value) Time-Phased Plan for Consumption of Resources Typical “S” Curve 20 15 10 5 ▲ M J F M A J D A S O N Time
J M J A A J Integrated Baseline Review (IBR):Does Planned Resource ConsumptionMake Sense? Program Budget $ Resources Front Loaded Normal 400 End Loaded 300 200 100 Time M F
Program Budget Front Loaded $ Resources 400 300 J A A J M J 200 100 Time M F Baseline Extremes: Front-Loaded • Rapid start • Most resources to be consumed early in plan • Questions • What is basis for plan? • Are resources available? • Do IBR and review supporting documentation
Program Budget $ Resources 400 End Loaded 300 200 100 A J M J A J Time M F Baseline Extremes: End-Loaded • Slow start • Most resources to be consumed late in plan • Questions • What is basis for plan? • Is schedule realistic? • Do IBR and review supporting documentation
Normal Baselines • Normal “S” curve for planned value • Questions • Is scope fully and mutually understood (using WBS)? • Does the baseline capture all work? • Labor resources • Are in-house resources available and adequate? • Are contractor resources available and adequate? • Material resources • Are contracts awarded/planned? • Is the schedule logical and complete? • Risk management • Is Management Reserve adequate given expected risk?
Normal Baselines cont’d • Management System • Does management system meet ANSI EVMS guidelines? • Are managers trained? • Are EVM techniques objective? • Is “Level of Effort” scope properly categorized? • The Bottom Line • Does the program have an executable plan that integrates scope, planned cost and schedule resources and risk? • If “no,” go slow… better to do it right than to fail
Time - Based Planning Horizons Rolling Wave 2 Rolling Wave 3 Rolling Wave 1 ProgramBudget $ Resources Initial detail planning (6 Months) 400 300 • Future work in planning packages • Detail planning based on calendar • Arbitrary 200 100 Time S D M J D M J S
Event - Based Planning Horizons Critical Design Review Preliminary Design Review ProgramBudget $ Resources Initial detail planning • Future work in planning packages • Detail planning based on technical objectives • Facilitates event-based reporting incentives • Better integration of technical, schedule and cost performance and risk management 400 300 200 100 Time S D M J D M J S
Agenda • Earned Value Management and Resource Management • Essential Data Elements and Graphics • Earned Value Analysis • EVA Scenarios • EVA and Funding Status • Baseline Management • Summary
Earned Value Analysis Scenarios The Ideal Portfolio Management Early Warning Indicators Know How to Get Help
Schedule Slips • Problem indicators • Early, large and unfavorable schedule variance • Front-loaded baseline • Zero variance • “Too good to be true” • Slow resource consumption • “Can’t get there from here”
Unfavorable Schedule Performance Time Now Prog Budget BCWS (Planned Value) Schedule Slip $ Resources 400 Schedule Variance BCWP (Earned Value) 300 200 100 Time ▲ A M J J J F M A
Unfavorable Schedule Performance Time Now Schedule Variance at completionis zero bydefinition-even if programcompleteslate $ Favorable 0 $ Unfavorable Time Schedule Variance Schedule variance should supplement “real” schedule analysis
Cost Overruns • Problem indicators • Early, large, unfavorable schedule variance • Time is money • Unfavorable cost variance • Front-loaded baseline • Zero variance • “Too good to be true” • Excessive resource consumption • “Can’t get there from here”
At Complete Variance J M J A A J Unfavorable Cost Performance Time Now Prog Budget Management Reserve ACWP (Actual Cost) $ Resources BCWS (Planned Value) Cost Variance 400 BCWP (Earned Value) 300 200 100 Time ▲ M F
Management Reserve Unfavorable Cost Performance Time Now $ Favorable 0 $ Unfavorable Time Cost Variance ---
Management Reserve Evaluating Future Performance Time Now $ Favorable 0 PM Varianceat Completion $ Unfavorable Time Cost Variance --- • When/how will performance improve? • Review at appropriate time • Tie PM evaluation to predictability
Management Reserve Evaluating Future Performance Time Now $ Favorable 0 PM Varianceat Completion $ Unfavorable Time Cost Variance --- • When/how will performance improve? • Review at appropriate time • Tie PM evaluation to predictability
A-12 Contract – Front Loaded • Largeunfavorable variances • “Connect the dots” • Front-loaded Baseline • (or completion date is wrong) • No work planned ’93 – ’96?
A-12 Contract – Actual Cost vs. EAC • Contractor and PM EACs both imply no cost accrual for several years during key manufacturing/test phases • Realistic EAC “off the chart”
Excessive Optimism • Problem indicators • Future performance predicted to be significantly better than historical performance • Variance trend analysis • Cost Performance Index compared toTo Complete Performance Index (CPI vs TCPI) • Actual trend and implied future trend diverging • One of most powerful EVA techniques • Independent EV analysis balances PM bias
A-12 Contract – Optimistic EACs • Contractor estimates program will begin to underrun • PM estimates all problems will be resolved – and no new problems will occur • Realistic EAC variance “off the chart”
Super Hornet Cumulative Trends • Cost-type contract • Significant cost risk • No variances • Too good to be true? • No scope change • Effective planning • IPTs used EVM effectively • Excellent performance
Super Hornet Variance Trends • Substantial Management • Reserve
Average Future Performance must Equal TCPI To Achieve Indicated Efficiency in Estimateat Completion Given Performance to Date (cumulative CPI) Past vs. Future Efficiency: CPI vs. TCPI Time Now TCPI EAC Efficiency Index CPI Cum CPI Current >1.0 1.0 <1.0 Time
CPICUM TCPIEAC ( ) 1 x 100 No Confidence Questionable Percent Difference Cumulative Efficiency / Required Efficiency Acceptable Questionable No Confidence Contract:FAA XXX Contractor:Air Systems Inc.as of January 2006 Confidence in EstimateCan program complete at PM’s current estimate? Adapted from USAF
Zeroing in on the EAC Contract Budget: PM Estimate: Independent High: Independent Low: $20.8M $20.8M $23.3M $22.0M $19 $20 $21 $22 $23 Contract:FAA XXXContractor: FAA Contractoras of April 2006 Adapted from USAF
Agenda • Earned Value Management and Resource Management • Essential Data Elements and Graphics • Earned Value Analysis • EVA Scenarios • EVA and Funding Status • Baseline Management • Summary
D M J S S J EVA and Funding Status Time Now Prog Budget BCWS (Planned Value) Resources 400 ACWP (Actual Cost) Approved/Planned Funding 300 200 BCWP (Earned Value) 100 Time D M
Cost Variance --- Schedule Variance Management Reserve Profitability Analysis on Flexibly Priced Contracts Cost Variance levelsrelated to: Time Now $ Favorable Min/MaxFee 0 Cost Sharing $ Unfavorable Contractor Loss Time
Cost Variance --- Schedule Variance Management Reserve Profitability Analysis on Flexibly Priced Contracts Cost Variance levelsrelated to: Time Now $ Favorable Min/MaxFee 0 Cost Sharing $ Unfavorable Contractor Loss Time
Agenda • Earned Value Management and Resource Management • Essential Data Elements and Graphics • Earned Value Analysis • EVA Scenarios • EVA and Funding Status • Baseline Management • Summary
Baseline Discipline • Effective performance management requires disciplined baseline management • Initial baseline reflects go-ahead decision • Scope, schedule, resources, risk • Approve baseline changes to • Revise work scope (increase or decrease) • Restore meaningful performance management • Manage funding reductions (“salami slices” or prioritized cuts?) • Balance scope, schedule, cost, risk assumptions • Do not approve baseline changes to • “Get to Green” • Eliminate cost and schedule variances
J A J O O J Baseline Discipline Time Now Program Budget BCWS ACWP $ Resources • No Variances • Lack of definition and discipline • Baseline & schedule growth preclude measurement 400 300 BCWP 200 100 Time J A
Rebaselining • When the original baseline becomes unrealistic as a basis for management and measurement, it may be necessary to establish a new baseline • A question of degree – what is ‘unrealistic?’ • Challenge assumptions • Issues: • Visibility to original baseline • Reporting to stakeholders
M D J S Establishing a New Baseline Time Now Program Budget Management Reserve $ Resources ACWP • Baseline no longer meaningful to manage performance 400 BCWS 300 200 BCWP 100 Time ▲ D A
M J D J S S Establishing a New Baseline Time Now Revised Budget Program Budget Original Budget Management Reserve NewBaseline BCWS $ Resources ACWP 400 BCWS • “Single Point Adjustment” • Eliminates variances • Establishes new baseline including Reserve if needed 300 200 BCWP 100 RevisedSchedule ▲ D A
Cost Variance ------- Schedule Variance Management Reserve Establishing a New Baseline Time Now $ Favorable 0 $ Unfavorable Time
Cost Variance ------- Schedule Variance Management Reserve Establishing a New Baseline Time Now $ Favorable 0 • “Single Point Adjustment” • Eliminates variances • Establishes new baseline including MR if needed • History is lost • Temptation to “get to Green” $ Unfavorable Time
Cost Variance ------- Schedule Variance Management Reserve Establishing a New Baseline Time Now $ Favorable 0 $ Unfavorable Time