Download

1 / 93
990 likes | 1.25k Views
Overview of Financial Institutions. Overview of Financial Institutions. Overview of Depository Institutions. This chapter discusses depository FIs: Size, structure, and composition Balance sheets and recent trends Regulation of depository institutions Depository institutions performance.

E N D
Overview of Depository Institutions • This chapter discusses depository FIs: • Size, structure, and composition • Balance sheets and recent trends • Regulation of depository institutions • Depository institutions performance
Products of U.S. FIs • Comparing the products of FIs in 1950, to products of FIs in 2007: • Much greater distinction between types of FIs in terms of products in 1950 than in 2010 • Blurring of product lines and services over time and wider array of services • (Refer to Tables 2-1A and 2-1B in the text)
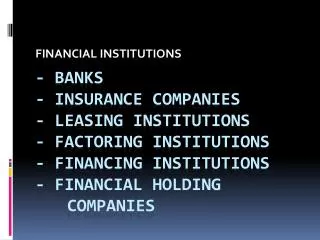
Specialness of Depository FIs • Products on both sides of the balance sheet • Loans • Business and Commercial • Deposits
Other outputs of depository FIs • Other products and services 1950: • Payment services, savings products, fiduciary services • By 2007, products and services further expanded to include: • Underwriting of debt and equity, Insurance and risk management products
Size of Depository FIs • Consolidation has created some very large FIs • Combined effects of disintermediation, global competition, regulatory changes, technological developments, competition across different types of FIs
Largest US Depository Institutions Holding Co. Assets ($Billions) • J.P.Morgan Chase 2,041.0 • Bank of America 2,252.8 • Citigroup 1,888.6 • Wells Fargo 1,228.6 • U.S. Bancorp 265.1 • HSBC North America 390.7 • Bank of NY Mellon 212.5 • Suntrust 178.3 • State Street Corp. 162.7 • BB&T 165.3
Commercial Banks • Largest depository institutions are commercial banks • Differences in operating characteristics and profitability across size classes • Notable differences in ROE and ROA, as well as the spread • Mix of very large banks with very small banks
Structure and Composition • Shrinking number of banks: • 14,416 commercial banks in 1985 • 12,744 in 1989 • 6,911 in 2009 • Mostly the result of Mergers and Acquisitions • M&A prevented prior to 1980s, 1990s • Consolidation has reduced asset share of small banks
Regulation, Functions & Structure • Functions of depository institutions • Regulatory sources of differences across types of depository institutions. • Structural changes generally resulted from changes in regulatory policy • Example: Changes permitting interstate branching • Reigle-Neal Act
Structure & Composition of Commercial Banks • Financial Services Modernization Act 1999 • Allowed full authority to enter investment banking (and insurance) • Limited powers to underwrite corporate securities have existed only since 1987
Composition of Commercial Banking Sector • Community banks • Regional and Super-regional • Access to federal funds market to finance their lending and investment activities • Money Center banks • Bank of New York Mellon, Deutsche Bank (Bankers Trust), Citigroup, J.P. Morgan Chase, HSBC Bank USA • Declining in number
Balance Sheet and Trends • Business loans have declined in importance • Offsetting increase in securities and mortgages • Increased importance of funding via commercial paper market • Securitization of mortgage loans • Temporary effects: credit crunch during recessions of 1989-92 and 2001-02
Commercial Banks, September 2009 • Primary assets: • Real Estate Loans: $3,799.3 B • C&I loans: $1,210.7 B • Loans to individuals: $959.1 B • Investment security portfolio: $3,335.2 B • Of which, Treasury securities: $1,225.5 B • Inference: Importance of Credit Risk
Commercial Banks • Primary liabilities: • Deposits: $8,178.2 billion • Borrowings: $2,065.6 billion • Other liabilities: $307.4 billion • Inference: • Highly leveraged
Some Terminology • Transaction accounts • Negotiable Order of Withdrawal (NOW) accounts • Money Market Mutual Fund • Negotiable CDs: Fixed-maturity interest bearing deposits with face values over $100,000 that can be resold in the secondary market
Equity • Commercial Banks equity capital • 11.08 percent of total liabilities and equity (2009) • TARP program 2008-2009 intended to encourage increase in capital • Citigroup $25 B • BOA $20 B • Through 2009: $300 B in capital injections through TARP
Off-Balance-Sheet Activities • Heightened importance of off-balance-sheet items • OBS assets, OBS liabilities • Regulatory incentives • Risk control and risk producing • Role of mortgage backed securities • “Toxic” assets • Expansion of oversight
Major OBS Activities • Loan commitments • Standby letters of credit and letters of credit • Futures, forwards, and swaps • When-issued securities
Other Fee-Generating Activities • Trust services • Correspondent banking • Check clearing • Foreign exchange trading • Hedging • Participation in large loan and security issuances • Payment usually in terms of noninterest bearing deposits
Bank Regulators Go to the pdf slide about OJK
Savings Institutions • Comprised of: • Savings and Loans Associations • Savings Banks • Effects of changes in Federal Reserve’s policy of interest rate targeting combined with Regulation Q and disintermediation • Effects of moral hazard and regulator forbearance • Qualified Thrift Lender (QTL) test
Savings Institutions: Recent Trends • Industry is smaller overall • Intense competition from other FIs • Mortgages, for example
Primary Regulators • Office of Thrift Supervision (OTS) • Charters and examines all federal S&Ls • FDIC-DIF Fund • FDIC Oversaw and managed Savings Association Insurance Fund (SAIF) • SAIF and BIF merged in January 2007 to form DIF • Same regulatory structure applied to commercial banks
Credit Unions • Nonprofit DIs owned by member-depositors with a common bond • Exempt from taxes and Community Reinvestment Act (CRA) • Expansion of services offered in order to compete with other FIs • Claim of unfair advantage of CUs over small commercial banks
Global Issues • Spread of US financial crisis to other countries • Many European banks saved from bankruptcy through support of governments and central banks • Interest rates at or below 1 percent • Links to the macroeconomy
Overview • This chapter discusses insurance companies • Two major groups: • Life • Property & Casualty • Financial crisis and insurance companies • Size, structure, and composition • Balance sheets and recent trends • Regulation of insurance companies • Global competition and trends
Insurance and Financial Crisis • Insurance companies as investors in securities • Subprime mortgage pools fell in value • Credit default swaps (CDS) fell • AIG was a major writer of CDS securities • Potential impact on other companies used to justify AIG bailout • Increased risk exposure
Insurance Companies • Differences in services provided by: • Life insurance companies • Property and casualty insurance
Size, Structure & Composition • Size, structure, and composition of the industry: • In 1988: 2,300 life insurance companies with aggregate assets of $1.12 trillion • Mid 2000s: 1,300 companies • In early 2006: $4.5 trillion in assets • 3 largest wrote 25% of new premium business in 2008
Size, Structure & Composition continued: • In 2009: $0.7 trillion in assets • Increasing involvement of commercial banks • In 2008: Commercial banks sold 30.5 percent of fixed annuity insurance contracts and 12.) percent of variable rate insurance contracts
Life Insurance Companies • Significant consolidation in life insurance industry although not to the same extent witnessed in banking • Competition from within industry and from other FIs • Conversion to stockholder controlled companies
Life Insurance: Issues • Demutualization • Adverse selection • Insured have higher risk than general population • Alleviated by grouping of policyholders into risk pools
Life Insurance Companies • Life insurance products: • Ordinary life • Term life, whole life, endowment life • Variable life, universal life, variable universal life • Group life • Industrial life • Credit life
Other Life Insurer Activities • Annuities • Reverse of life insurance activities • Topped $347.4 billion in 2008 • Ethics: Conseco, 2004 • Private pension funds • Compete with other financial service cos. • In 2009, managing over $2.2 trillion (43% of all private pension plans) • Accident and health insurance • Morbidity insurance • Over 167.1 billion in premiums in 2008
Balance Sheet • Long-term assets • Need to generate competitive returns on savings components of life insurance policies • Bonds, equities, government securities • Policy loans • Long-term liabilities • Net policy reserves to meet policyholders’ claims • Separate account business 3 represented 0.1% of total liabilities and capital in 2009
Recent Trends • Impact of financial crisis • Drop in value of securities • Capital losses from bonds and stocks exceeded $35 billion • Historically low short term interest rates • Adverse impact on ability to lower rates on new policies • Incentive to surrender existing policies • Dwindling reserves led to Treasury Department extending bailout funds • Late 2009 showed improvement
Property and Casualty Insurance • Size and Structure • Currently about 2,000 companies • Highly concentrated; Top 10 firms have over 50% of market in terms of premiums written • Top 100 firms: over 95% • M&A activity is increasing concentration
P&C Products • Fire insurance and allied lines • Homeowners multiple peril insurance • Commercial multiple peril insurance • Automobile liability and physical damage insurance • Liability insurance (other than automobile)
Property & Casualty • Changing composition of net premiums written, 2008 versus 1960: • Decline in fire insurance and allied lines: 2.4% in 2008 vs. 16.6% in 1960 • Homeowners MP: 13.3% vs. 5.2% in 1960 • Commercial MP: 7.1% vs. 0.4% in 1960 • Auto L&PD: 39.1% vs. 43% in 1960 • Other liability: 12.8% vs. 6.6% in 1960
P&C Balance Sheet • Similar to life insurance companies (smaller asset base) • Requirement for liquid assets • Major liabilities • Loss reserves • Loss adjustment expense • Unearned premiums
Loss Risk • Underwriting risk may result from: • Unexpected increases in loss rates • Unexpected increases in expenses • Unexpected decreases in investment yields or returns • Property versus liability • Losses from liability insurance less predictable • Example: Claims due to asbestos damage to workers’ health