Download
1 / 31
330 likes | 402 Views
Harini Chandra Affiliations. Protein separation techniques – basic electrophoresis.

E N D
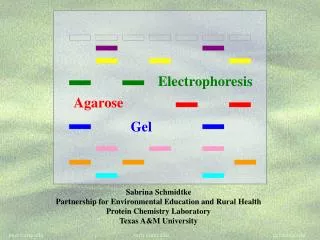
Harini Chandra Affiliations Protein separation techniques – basic electrophoresis Electrophoresis is a powerful technique for protein separation and separated proteins can be visualized after subsequent staining steps. It is based on the principle of migration of charged proteins in an electric field.
Master Layout (Part 1) 1 This animation will consist of 2 parts. Protein purification by: Part 1 – Sodium Dodecyl Sulphate (SDS)-PAGE Part 2 – Blue Native (BN)-PAGE SDS-PAGE 2 Buffer Cathode 3 Polyacrylamide gel with SDS Stained gel 4 Anode Buffer reservoir 5 Source: Biochemistry by A.L.Lehninger, 4th edition (ebook)
Definitions of the components:Part 1 – SDS-PAGE 1 1. SDS-PAGE: A protein separation technique based on gel electrophoresis that is carried out under denaturing conditions. Separation in SDS-PAGE occurs almost exclusively on the basis of molecular weight since all proteins have a similar charge-to-mass ratio and shape after they have bound SDS. 2. Sample: In SDS-PAGE, the protein sample to be analyzed is mixed with sodium dodecyl sulphate (SDS), an anionic detergent that causes the protein to denature. Roughly one molecule of SDS binds to every two amino acid residues. Therefore the amount of SDS binding to any protein will be proportional to its molecular weight. This also confers a large negative charge on every protein, thereby causing the original intrinsic charge of the protein to be insignificant. A small amount of reducing agent like dithiothreitol (DTT) or b-mercaptoethanol is also added which reduces the disulphide linkages present in the protein. A tracking dye like bromophenol blue (BPB) which is a small molecule and migrates ahead of other sample proteins is added to know the distance of migration during the course of electrophoresis. 3. Polyacrylamide gel: The gel for SDS-PAGE consists of acrylamide, N,N’-methylenebisacrylamide and SDS in a suitable buffer. The molecular dimensions of the pores can be controlled by varying the amount of N,N’-methylenebisacrylamide with free-radical cross-linking being facilitated by APS and TEMED. 4. Well: These are small indentations made in the gel into which the sample is loaded. Usually, several samples can be run in parallel lanes simultaneously. 2 3 4 5
Definitions of the components:Part 1 – SDS-PAGE 1 5. Buffer:A solution that can resist any changes in pH is known as a buffer. For electrophoresis, a buffer solution that can maintain the protein molecules with a net negative charge is placed in both upper and lower reservoirs of the electrophoresis unit. The negative charge ensures that all molecules migrate in one direction towards the anode in the lower reservoir. 6. Cathode and Anode: The oppositely charged electrodes to which current is applied. The negatively charged protein molecules migrate towards the positive anode. 7. Stained gel: After the gel has been run, the separated bands can be viewed by several methods. Staining them with an appropriate dye is the most common technique for visualizing proteins. Coomassie brilliant blue is one of the most widely used dyes. However, anothersensitive technique is silver staining which allows proteins to be detected in nanogram quantities. 2 3 4 5
Part 1, Step 1: 1 Gel casting Buffer 2 Gel containing SDS 3 Polyacrylamide gel cast for SDS-PAGE Electrophoresis unit Action Description of the action Audio Narration 4 The regions marked as ‘gel’ and ‘buffer’ must be filled with a light blue colour. The polyacrylamide gel containing SDS is cast between glass plates as a vertical slab in the same buffer that is used for electrophoresis. The molecular dimensions of the pores can be controlled by varying the amount of N,N’-methylenebisacrylamide with free-radical cross-linking being facilitated by APS and TEMED. (Please redraw all figures.) The figure on the left must be shown first. Then, the regions marked as ‘gel’ and ‘buffer’ must be filled with a light blue colour. 5 Source: Biochemistry by A.L.Lehninger, 4th edition (ebook)
Part 1, Step 2: 1 Sample well creation Well comb Sample wells 2 3 4 Action Description of the action Audio Narration (Please redraw all figures.) The comb must be moved downward in the direction shown. It must rest in the blue region for a couple of seconds and then must be moved back upwards as shown in the third figure. Once it is moved upwards, the sample wells must appear. The marked ‘sample wells’ must be made in the gel as shown. Sample wells of uniform size, shape and separation are made using a comb which is placed in the gel as soon as it has been poured. After the gel has polymerized, the comb is removed, providing a gel ready for the process. 5 Source: Biochemistry by A.L.Lehninger, 4th edition (ebook)
Part 1, Step 3: 1 Sample preparation Negatively charged SDS 2 SDS, DTT & BPB added 3 Sample heating Denatured proteins bound to SDS Folded proteins Protein sample 4 Action Description of the action Audio Narration SDS is a negatively charged anionic detergent that binds to protein molecules and causes them to denature. The DTT used breaks any disulphide linkages that may be present. The binding of SDS causes the proteins to have a uniform charge-to-mass ratio, thereby allowing separation purely on the basis of molecular weight. (Please redraw all figures.) First the green solution must be added to the grey solution in the tube, which must then turn green. The grey oval below the tube must then turn red to indicate heating. Sample must be zoomed into and figures inside the circle must be shown The green solution must be added to the grey solution in the tube followed by animations as shown 5
Part 1, Step 4: 1 Sample loading Loaded well 2 3 Protein sample mixed with SDS and DTT 4 Action Description of the action Audio Narration The hand should move from tube to each of the sample wells next with each one being coloured blue as it moves. (Please redraw all figures.) First show the figure on the left with the hand moving into the tube and coming out. Then show the hand moving into the first well as shown in the middle panel. The well must be filled with a blue colour as in the third panel. The hand must then be moved back up and into the second well. The second well must similarly be filled with the blue colour. This must continue until all wells are filled up. The protein samples are loaded into the wells with the help of a micropipette. 5 Source: Biochemistry by A.L.Lehninger, 4th edition (ebook)
Part 1, Step 5: 1 Sample electrophoresis Connected to supply 2 Direction of migration 3 Buffer in reservoir 4 Action Description of the action Audio Narration Once the samples have been loaded, a direct current supply between 100-350 V is passed depending upon the size of the gel for a time sufficient to separate the protein mixture into discrete bands based on their molecular weight. Progress of electrophoresis can be observed with the help of tracking dye . The larger proteins are retarded in the gel and remain close to the point of application while the smaller proteins migrate further along the gel. The wavy lines must move as shown in the figure. The purple line must move farthest followed by red and then green. (Please redraw all figures.) First show the figure on the left.The figure must be zoomed into and the first blue square must appear. The lines shown on the top must move slowly in the direction indicated to the positions shown in the second blue square. The lines must then again move further until the third blue square positions are reached. 5 Source: Biochemistry by A.L.Lehninger, 4th edition (ebook)
Part 1, Step 6: 1 Gel staining and viewing Silver stained gel Coomassie stained gel High molecular weight proteins 2 3 Low molecular weight proteins 4 Action Description of the action Audio Narration (Please redraw all figures.) The figure with all its labels must appear. The gel is then stained with either Coomassie orsilver and viewed to observe the various discrete protein bands. This figure should appear 5
Master Layout (Part 2) 1 This animation will consist of 2 parts. Protein purification by: Part 1 – Sodium Dodecyl Sulphate (SDS)-PAGE Part 2– Blue Native (BN)-PAGE BN-PAGE 2 Buffer 5 6 7 2 Cathode 3 4 1 3 Polyacrylamide gel ( with TEMED & APS) 4 Stained gel Anode Buffer reservoir 5 Source: Biochemistry by A.L.Lehninger, 4th edition (ebook)
Definitions of the components:Part 2 – BN-PAGE 1 1. BN-PAGE: Native PAGE is an electrophoretic separation technique that is carried out under non-denaturing conditions and separates proteins on the basis of their net charge and size. Blue native (BN) PAGE is a variation of native PAGE technique where Coomassie blue dye is added to the sample to provide the necessary charge to the protein complexes for migration and separation in the gel. Unlike SDS however, Coomassie does not denature the protein sample. It is often used to determine molecular weight of native proteins and is extremely useful for single step isolation of proteins from cell and tissue homogenates. 2. Sample: This consists of the protein mixture that needs to be separated based on their net charge and size. The sample is mixed with Coomassie which gives the proteins the necessary charge for separation in the gel. In order to prevent the sample from mixing with the buffer solution, it is usually dissolved ina minimal amount of dense material like glycerol or sucrose solution. A tracking dye like bromophenol blue (BPB) which is a small molecule and migrates ahead of other sample proteins is added to know the distance of migration during the course of electrophoresis. 3. Polyacrylamide gel: It is one of the most commonly used gels for electrophoretic separations and is prepared by free radical-induced polymerization of acryl-amide and N,N’-methylenebisacrylamide (cross-linking agent) in a suitable buffer. Ammonium persulfate (APS) and tetramethylethylenediamine (TEMED) are added to facilitate generation of free radicals and cross-linking. The molecular dimensions of the pores can be controlled by varying the amount of N,N’-methylenebisacrylamide. The separation is therefore, carried out according to both the size and charge of the protein such that large molecules are retained in the gel more than smaller ones. 2 3 4 5
Definitions of the components: Part 2 – BN-PAGE 1 4. Well: These are small indentations made in the gel into which the sample is loaded. Usually, several samples can be run in parallel lanes simultaneously. 5. Buffer: A solution that can resist any changes in pH is known as a buffer. For electrophoresis, a buffer solution that can maintain the protein molecules with a net negative charge is placed in both upper and lower reservoirs of the electrophoresis unit. The negative charge ensures that all molecules migrate in one direction towards the anode in the lower reservoir. 6. Cathode and Anode: The oppositely charged electrodes to which current is applied. The negatively charged protein molecules migrate towards the positive anode. 7. Stained gel: After the gel has been run, the separated bands can be viewed by staining them with an appropriate dye. For proteins, the most commonly used dye is Coomassie brilliant blue. The gel is soaked in an acidic, alcoholic solution of the dye, which denatures the protein and fixes it in the gel and also complexes the dye to the protein. 2 3 4 5
Part 2, Step 1: 1 Gel casting Buffer 2 Gel 3 Polyacrylamide gel cast for electrophoresis Electrophoresis unit Action Description of the action Audio Narration 4 The polyacrylamide gel is cast between glass plates as a vertical slab in the same buffer that is used for electrophoresis. The gel is prepared by free radical-induced polymerization of acryl-amide and N,N’-methylenebisacrylamide in a suitable buffer. Ammonium persulfate (APS) and tetramethylethylenediamine (TEMED) are added to facilitate generation of free radicals and cross-linking. The molecular dimensions of the pores can be controlled by varying the amount of N,N’-methylenebisacrylamide. The regions marked as ‘gel’ and ‘buffer’ must be filled with a light blue colour. (Please redraw all figures.) The figure on the left must be shown first. Then, the regions marked as ‘gel’ and ‘buffer’ must be filled with a light blue colour. 5 Source: Biochemistry by A.L.Lehninger, 4th edition (ebook)
Part 2, Step 2: 1 Sample well creation Well comb Sample wells 2 3 4 Action Description of the action Audio Narration (Please redraw all figures.) The comb must be moved downward in the direction shown. It must rest in the blue region for a couple of seconds and then must be moved back upwards as shown in the third figure. Once it is moved upwards, the sample wells must appear. The marked ‘sample wells’ must be made in the gel as shown. Sample wells of uniform size, shape and separation are made using a comb which is placed in the gel as soon as it has been poured. After the gel has polymerized, the comb is removed, providing a gel ready for the process. 5 Source: Biochemistry by A.L.Lehninger, 4th edition (ebook)
Part 2, Step 3: 1 Sample preparation Negatively charged SDS 2 Coomassie blue dye 3 Native proteins bound to Coomassie Folded proteins Protein sample 4 Action Description of the action Audio Narration (Please redraw all figures.) First the blue solution must be added to the grey solution in the tube, which must then turn blue. Sample must be zoomed into and the figure in first circle must be shown. The circles with negative charge must then be shown to bind to the green & purple ‘proteins’ as depicted in second circle. The green solution must be added to the grey solution in the tube followed by animations as shown The protein sample, present in a suitable buffer system, is mixed with the Coomassie blue dye which provides the necessary charge to the protein complexes thereby facilitating their separation in the gel. Unlike SDS, the dye does not denature the proteins but binds to them in their native state. 5
Part 2, Step 4: 1 Sample loading 2 3 Protein sample 4 Action Description of the action Audio Narration The hand should move into the tube and then into each well with each one being coloured blue as it moves. (Please redraw all figures.) First show the figure on the left with the hand moving into the tube and coming out.. Then show the hand moving into the first well as shown in the middle panel. The well must be filled with a blue colour as in the third panel. The hand must then be moved back up and into the second well. The second well must similarly be filled with the blue colour. This must continue until 7 of the 10 wells are filled up. The protein samples are then loaded into the wells with the help of a micropipette. 5 Source: Biochemistry by A.L.Lehninger, 4th edition (ebook)
Part 2, Step 5: 1 Sample electrophoresis Connected to supply 2 Direction of migration 3 Buffer in reservoir 4 Action Description of the action Audio Narration Once the samples have been loaded, a direct current supply of around 100-350 V is passed depending upon the size of the gel for a time sufficient to separate the protein mixture into discrete bands based on their charge-to-mass ratio. Progress of electrophoresis can be observed with the help of tracking dye . The larger proteins are retarded in the gel and remain close to the point of application while the smaller proteins migrate further along the gel. The small lines shown in the blue squares on the right must be shown to move in the direction indicated. (Please redraw all figures.) First show the figure on the left.The figure must be zoomed into and the first blue square must appear. The lines shown on the top must move slowly in the direction indicated to the positions shown in the second blue square. The lines must then again move further until the third blue square positions are reached. 5 Source: Biochemistry by A.L.Lehninger, 4th edition (ebook)
Part 2, Step 6: 1 Gel staining and viewing 2 Gel stained with Coomassie brilliant blue. High molecular weight proteins 5 6 7 2 3 4 1 3 Low molecular weight proteins 4 Action Description of the action Audio Narration (Please redraw all figures.) The figure with all its labels must appear. The gel is then stained with Coomassie brilliant blue and viewed to observe the various discrete protein bands. This figure should appear 5
Interactivity option 1:Step No: 1 1 Three tubes having protein samples containing insulin, myglobin and hemoglobin are present. Insulin is a 51 amino acid peptide hormone having a molecular weight of 5.8kD. It is composed of two chains linked by disulphide bonds and plays a very important role in maintenance of blood glucose levels. Myoglobin is an oxygen-binding, globular protein composed of a single polypeptide chain having 154 amino acid residues with a molecular weight of 16.7kD. It is made up of 8 alpha helices and is structurally related to hemoglobin. Hemoglobin is an iron containing, oxygen-transport protein. It is composed of four subunits (2a and 2b) linked together by salt bridges and other hydrophobic interactions with a mass of 68kD. How can one determine which tube contains which protein and then estimate the number of subunits present in each protein? 2 3 2. Run all three samples by SDS-PAGE. 1. Run all three samples by BN-PAGE. 3. Run all three samples by both BN-PAGE and SDS-PAGE. 4 Results Interactivity Type Options Boundary/limits User should be allowed to choose any one of the options. If he chooses 1 or 2, they should turn red but they can try again. If user chooses the third option, it should turn green. If user chooses option 1 or 2, it should turn red with a ‘incorrect method’ error message. The user can try until he clicks the correct answer. If user chooses option 3, it should turn green and user should be redirected to sample animation slides (Steps 2 a-d) Click on any of the three option tabs. 5
Interactivity option 1:Step No:2 (a) 1 A comparison of the electrophoretic separation profiles of hemoglobin, insulin and myoglobin using both BN-PAGE and SDS-PAGE will allow one to determine which tube contains which protein sample and how many subunits may be present in each protein. 2 Insulin: Has two polypeptide chains of different mass held together by disulphide linkages. 3 Hemoglobin (Hb): Tetramer consisting of 2a and 2b subunits, held together by salt bridges, hydrophobic interactions and hydrogen bonds. Myoglobin (Mb): It is a single chain globular protein having eight alpha helices. 4 5
Interactivity option 1:Step No:2 (b) 1 A comparison of the electrophoretic separation profiles of hemoglobin, insulin and myoglobin using both BN-PAGE and SDS-PAGE will allow one to determine which tube contains which protein sample and how many subunits may be present in each protein. 2 BN-PAGE SDS-PAGE Samples mixed with SDS and DTT Samples loaded as such 3 Native polyacrylamide gel Polyacrylamide gel with SDS 4 5 Buffer in reservoir
Interactivity option 1:Step No:2 (c) 1 A comparison of the electrophoretic separation profiles of hemoglobin, insulin and myoglobin using both BN-PAGE and SDS-PAGE will allow one to determine which tube contains which protein sample and how many subunits may be present in each protein. 2 SDS-PAGE BN-PAGE 2 1 3 2 1 3 Direction of migration 3 4 5
Interactivity option 1:Step No:2 (d) 1 A comparison of the electrophoretic separation profiles of hemoglobin, insulin and myoglobin using both BN-PAGE and SDS-PAGE will allow one to determine which tube contains which protein sample and how many subunits may be present in each protein. 2 SDS-PAGE Completed gels stained with Coomassie blue. BN-PAGE 1 3 4 2 1 2 4 3 Hb (68kD) MW marker, Pepsin, (35 kD) 3 MW marker, Pepsin, (35 kD) Hb (b-subunit) Hb (a-subunit) Mb (16.7kD) Mb Insulin (5.8kD) Insulin B chain Insulin A chain 4 More than 1 band will appear for Hb and insulin indicating that they have multiple subunits. The thicker bands are indicative of more than one subunit of nearly identical molecular mass. Since the molecular weight of each protein is known, the migration distance will indicate which band corresponds to which protein. 5
Interactivity option 2:Step No: 1 1 Which technique would be suitable for determination of molecular weight of the enzyme a-amylase? Although this technique may be used, it may not always be very accurate since it also depends on net charge of the protein. 2 1. BN-PAGE 3 2. SDS-PAGE 4 Results Interacativity Type Options Boundary/limits User should be allowed to choose any one of the options. If he chooses 1, it should turn red and the message displayed must be shown. If user chooses 2, it should turn green and user must be redirected to steps 2(a)-(c) If user chooses option 1, it should turn red and the message shown must be displayed. The user can then choose the other option and be redirected to steps 2(a)-(d). If user chooses option 2, it must turn green and he is redirected to steps 2(a)-(d). Click on any of the two option tabs. 5
Interactivity option 2:Step No:2 (a) 1 Determination of molecular weight of a-amylase: SDS-PAGE is commonly used for determination of molecular weight of an unknown protein by running it along with other protein markers of known molecular weight. 2 Samples mixed with SDS and DTT 3 Polyacrylamide gel with SDS 4 5 Sample loading Buffer in reservoir
Interactivity option 2:Step No:2 (b) 1 Determination of molecular weight of a-amylase: SDS-PAGE is commonly used for determination of molecular weight of an unknown protein by running it along with other protein markers of known molecular weight. 2 Connected to supply 1 2 Protein markers a-amylase 3 Direction of migration 4 Sample electrophoresis 5
Interactivity option 2:Step No:2 (c) 1 Determination of molecular weight of a-amylase: SDS-PAGE is commonly used for determination of molecular weight of an unknown protein by running it along with other protein markers of known molecular weight. 2 1 2 BSA a-amylase BSA 3 Papain a-amylase Pepsin Papain Pepsin 4 Lysozyme Lysozyme Completed gel stained with Coomassie blue. 5 Mobility of the unknown protein can therefore be used to determine its molecular weight from a graph as shown above. Based on this, molecular weight of a-amylase is 53kD.
Questionnaire 1 1. Four proteins W, X, Y and Z have molecular weights of 25.4kD, 80.2kD, 30.5kD and 44.3kD respectively. Which of them will migrate the farthest when run by SDS-PAGE? Answers: a) X b) Y c) W d) Z 2. If the pH of the electrophoresis buffers are modified to have a pH of 2.3, then what would happen to the proteins? They would Answers: a) Migrate towards anode b) Migrate towards cathode c) Remain stationary d) Get denatured 3. How many bands would appear for a protein having 3 subunits linked together by disulphide bonds in native and SDS-PAGE? Answers:a) 1 and 3 b) 3 and 1 c) 3 and 3 d) 1 and 1 4. The relative electrophoretic mobilities of a 45kD and a 70kD protein on SDS-PAGE are respectively 0.7 and 0.3. What would be the molecular mass of a protein with relative mobility of 0.44? Answers:a) 68kD b) 54kD c) 80kD d) 60kD 2 3 4 5
Questionnaire 1 5. Match the protein with the number of subunits they contain. 1. Myglobin i) 2 2. Hemoglobin ii) 1 3. Insulin iii) 4 Answers:a) 1-ii, 2- iii, 3-i b) 1-i, 2-ii, 3-iii c) 1-iii, 2-ii, 3-i d) 1-i, 2-iii, 3-ii 2 3 4 5
Links for further reading Books: Biochemistry by Stryer et al., 5th edition Biochemistry by A.L.Lehninger et al., 3rd edition Biochemistry by Voet & Voet, 3rd edition Research papers: • Pyndiah, S. et al., Two-dimensional Blue Native/SDS gel electrophoresis of multiprotein complexes from Helicobacter pylori. Mol. Cell. Proteomics 2007, 6, 193-206. • Camacho-Carvajal, M. M. et al., Two-dimensional Blue Native/SDS Gel Electrophoresis of Multi-Protein Complexes from Whole Cellular Lysates. Mol. Cell. Proteomics 2004, 3, 176-182. • Wittig, I., Braun, H. P., Schägger, H. Blue native PAGE. Nat. Protoc. 2006, 1(1), 418-428.