Download
1 / 27
270 likes | 288 Views
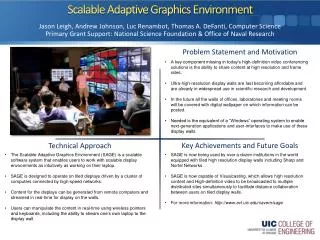
This paper explores the architecture and features of the Scalable Adaptive Graphics Environment (SAGE), a specialized visualization middleware for visualizing large amounts of data in real-time, enabling distant collaboration in a high-resolution display environment. The paper also discusses user requirements, the SAGE rendering model, and the SAGE demonstration in the EVL.

E N D
Collaborative Visualization Architecturein Scalable Adaptive Graphics Environment Byungil Jeong Electronic Visualization Laboratory, University of Illinois at Chicago
Introduction • Data intensive domains need to visualize huge amount of data • Data storage, computation and visualization resource • Networking cost down • => Sharing remote computation and visualization resource and data storage • => The fundamental premise behind shared cyber-infrastructure • OptIPuter: designing advanced cyber-infrastructure for data-intensive science using optical networks • User requirements • - Visualize large data in real-time using remote visualization resources • - Seeing and interacting multiple high-resolution visualization at a time • - Distant collaboration in high-resolution display environment • Scalable Adaptive Graphics Environment (SAGE) : a specialized visualization middleware to support these user requirements - 2 -
Scalable Adaptive Graphics Environment (SAGE) Remote sensing Live video feeds Volume Rendering High-resolution maps 3D surface rendering Remote laptop • Information must be able to flexibly move around the wall - 3 -
SAGE Rendering Model - 4 -
SAGE Demonstration in EVL • LambdaVision: 11x5 tiled display, 100 Mega-pixel resolution • Using ultra high-speed networks (multi-ten gigabits/sec) - 5 -
User Driven Features of SAGE • Sharing remote visualization resource and data • Reducing visualization cost • Securely keeping original data in the visualization center • Unified visualization environment • Any visualization application can be integrated into SAGE • Simple pixel streaming API (10 to 20 lines of codes) • Scalability in performance and resolution • Fully multitasking environment on scalable displays • Scalable displays have been typically used for a single application • Concurrently run multiple visualization applications resizing and repositioning their windows - 6 -
SAGE Architecture Tiled Display SAGE UI SAGE UI disp1 disp2 dispN SAGE Receiver SAGE Receiver SAGE Receiver FreeSpace Manager render1 render2 renderM SAIL SAIL SAIL App App App SAGE Messages Synchronization Channel Pixel Stream SAIL: SAGE Application Interface Library - 8 -
How to manage dynamic pixel streams? 1 2 3 Connect A B 4 5 6 1 2 3 Reconfigure Reconfigure Receiving Buffer Texture Rectangle Image Partition Active Connection 4 5 6 Render A Render B - 9 -
How to manage dynamic pixel streams? Obvious Approach Improved Approach FSManager FSManager Control Control Control SAGE Receiver SAGE Receiver SAIL SAIL Pixel Data Pixel Data • Obvious Approach (100 to 1000ms latency) • SAGE Receiver doesn’t know when newly partitioned data arrives • FSManager has to pause pixel streams for reconfiguration • Improved Approach (10 to 100ms latency) • SAIL sends control data together with pixel data • Reconfigure streams without stopping streaming - 10 -
How to Partition Pixel Data? Image Frame Streaming Streamer SAGE Display Pixel Block Streaming Streamer SAGE Display • Pixel block streaming: independent of window layouts • Good to stream pixels to multiple end-points • Small sized pixel block Increases system calls for network send and pixel downloading • Aggregation of pixel blocks - 11 -
Synchronization of Dynamic Streams Sync Group B Sync Group A Inactive Nodes Active Nodes • Each application has different refresh rate • => has to be synchronized independently • Groups of active or inactive nodes: dynamically changed • Using low latency TCP channel for sending sync signals - 12 -
Network Streaming Protocol • TCP module: low or unstable performance on long round-trip time wide-area networks (10Gbit networks) • UDP module: no data flow control => packet loss, artifacts • Extended the UDP module to control the data transfer rate not exceeding user definable upper bound • Packet loss was reduced below 1% - 13 -
SAGE Users • They want to collaborate each other using SAGE - 14 -
Visualcasting • Support distant collaboration with multiple endpoints • All participants interact with one another, as well as with their data • Various display configuration at each endpoint • Increasing the complexity of the pixel routing problem • Independent application layout at each endpoint • Dynamic changes in the number of applications and endpoints - 15 -
SAGE extended by Visualcasting SAGE only multiple sources single destination SAGE with Visualcasting multiple to multiple - 16 -
SAGE Bridge • A new software component of SAGE • Broadcasts pixel data to the endpoints • Running on a high-performance PC cluster • Placed at core hubs in the network - 17 -
How to Distribute Pixels to Multiple Endpoints? 4Mpix 1Gbps Rendering Duplication Partition Display 10Mpix 10Gbps Sending Side (Overloaded) Endpoints - 18 -
How to Distribute Pixels to Multiple Endpoints Regrouping 4Mpix 1Gbps Rendering Duplication Partition Display 10Mpix 10Gbps SAGE Bridge Sending Side Endpoints - 19 -
Visualcasting at SC06 • EVL(Calit2/UCSD), SARA(Dutch Consortium), University of Michigan(Research Channel) - 20 -
Performance Evaluation UIC UCSD • Two 28-node LambdaVision cluster in San Diego (UCSD) and Chicago (UIC) • National LambdaRail provided a 10gigabit dedicated optical network link between two cluster (CAVEWave) • Gigabit Ethernet (GigE) network interface fully connected to each other through a gigabit network switch • Excluding other traffic on the network • Jumbo frames are used (9KB data packet size) - 21 -
SAGE Streaming Performance • A high-resolution image viewer, streaming from San Diego to Chicago over 10Gbit dedicated link, UDP, 0.9Gbps upper bound • Over 80% of network utilization • Scalability in frame rate and resolution - 22 -
SAGE Bridge Performance • Total output bandwidth of a SAGE Bridge node • 1Mpixel images up to nine endpoints • Two dual core AMD 64bit CPU, a Myricom 10Gbit network interface • Supported up to 7 endpoints without loosing scalability. - 23 -
Current Research • How to arbitrarily scale simultaneous data distribution to multiple receivers? • Incremental bridge node allocation: If initially allocated nodes become overloaded, SAGE Bridge allocates additional nodes for the visualcasting session. • No additional node available: request senders to down-sample or compress pixel blocks • What are the conditions for adding or removing SAGE Bridge nodes? • How to support heterogeneity of endpoints in network bandwidth, computing power and display resolution? - 24 -
Conclusion • Wide-area distributed visualization is now feasible at ultra-high resolutions while maintaining interactivity. • SAGE Visualcasting supports global collaboration with multiple endpoints in scalable display environments. • Scalability and heterogeneous endpoint support of Visualcasting - 25 -
Acknowledgement • Support from the National Science Foundation: OptIPuter project, cooperative agreement OCI-0225642 to University of California, San Diego; MRI - LambdaVision • Thanks to Jason Leigh, Andrew Johnson, Luc Renambot, Tom Defanti • Thanks for excellent support of EVL support team - 26 -
More Info • SAGE: www.evl.uic.edu/cavern/sage • My web page: www.evl.uic.edu/bijeong • E-mail: bjeong2@uic.edu - 27 -