Download
1 / 12
120 likes | 124 Views
California Standards. SDAP1.2 Understand how additional data added to data sets may affect these computations. Also covered : SDAP1.1, SDAP1.3. Vocabulary. outlier. The mean, median, mode, and range may change when you add data to a data set. mean: 11 + 5 + 7 + 5 + 7. 5.

E N D
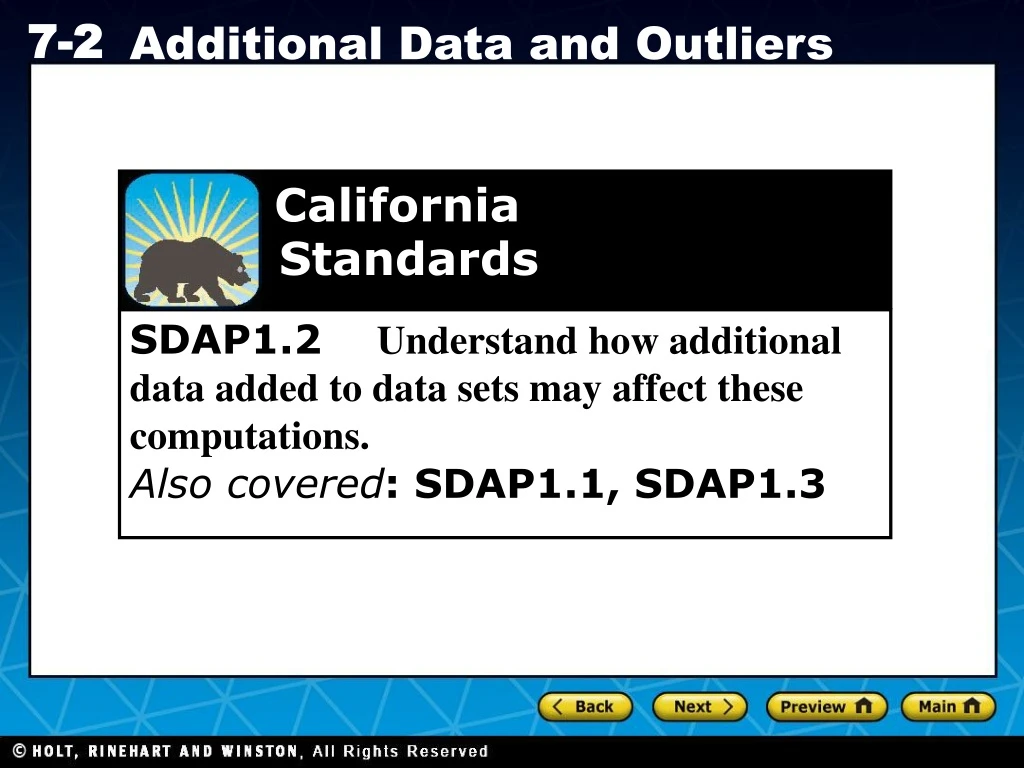
California Standards SDAP1.2 Understand how additional data added to data sets may affect these computations. Also covered: SDAP1.1, SDAP1.3
Vocabulary outlier
The mean, median, mode, and range may change when you add data to a data set.
mean:11 + 5 + 7 + 5 + 7 5 Additional Example 1A: Sports Application Find the mean, median, mode, and range of the data in the table. = 7 median: Write the data in numerical order: 5, 5, 7, 7, 11. mode: 5, 7 The values 5 and 7 occurs most often. Subtract the least value from the greatest value. range: 11 – 5 = 6
Additional Example 1B: Sports Application EMS also won 13 games in 1997 and 8 games in 1996. Add this data to the data in the table and find the mean, median, mode, and range. The mean increased by 2. mean: 9 median: 7 The median stayed the same. modes: 5, 7 The modes stayed the same. range: 8 The range increased by 2.
mean:13 + 6 + 4 + 6 + 11 5 Check It Out! Example 1A Find the mean, median, mode, and range of the data in the table. = 8 median: Write the data in numerical order: 4, 6, 6, 11, 13. mode: 6 The value 6 occurs most often. Subtract the least value from the greatest value. range: 13 – 4 = 9
Check It Out! Example 1B MA also won 15 games in 1997 and 8 games in 1996. Add this data to the data in the table and find the mean, median, and mode. The mean increased by 1. mean: 9 median: 8 The median increased by 2. mode: 6 The mode stayed the same. range: 11 The range increased by 2.
An outlier is a value in a set that is very different from the other values. One way to identify an outlier is by making a line plot. A line plot uses a number line and x’s or other symbols to show the frequencies of values.
100 200 300 400 500 600 700 800 900 Additional Example 2: Identifying Outliers The table shows the prices of television sets at a discount store. Which price represents an outlier? Step 1: Draw a number line. Step 2: For each television price, use an on the number line to represent its price in dollars. Prices of Televisions ($) The line plot shows that the value 849 is much greater than the other values in the set. The price of 849 represents an outlier.
1 2 3 4 5 6 7 8 9 10 11 12 Check It Out! Example 2 The table shows the number of inches of hair cut from a salon's last eight customers. Which length represents an outlier? Step 1: Draw a number line. Step 2: For each length, use an on the number line to represent its length in inches. Length of Hair Cuts (in.) The line plot shows that the value 12 is much greater than the other values in the set. The length of 12 represents an outlier.
Additional Example 3: Application Ms. Gray is 25 years old. She took a class with students who were 55, 52, 59, 61, 63, and 58 years old. Find the mean, median, mode, and range with and without Ms. Gray’s age. Data with Ms. Gray’s age: mean: 53.3 mode: none median: 58 range: 38 Data without Ms. Gray’s age: mean:58 mode: none median: 58.5 range: 11 When you add Ms. Gray’s age, the mean decreases by about 4.7, the mode stays the same, the median decreases by 0.5, and the range increases by 27. The mean and the range are most affected by the outlier.
Check It Out! Example 3 Ms. Pink is 56 years old. She volunteered to work with people who were 25, 22, 27, 24, 26, and 23 years old. Find the mean, median, mode, and range with and without Ms. Pink’s age. Data with Ms. Pink’s age: mean: 29 mode: none median: 25 range: 34 Data without Ms. Pink’s age: mean: 24.5 mode: none median: 24.5 range: 5 When you add Ms. Pink’s age, the mean increases by 4.5, the mode stays the same, the median increases by 0.5, and the range increases by 29. The mean and the range are most affected by the outlier.