Download
1 / 6
60 likes | 209 Views
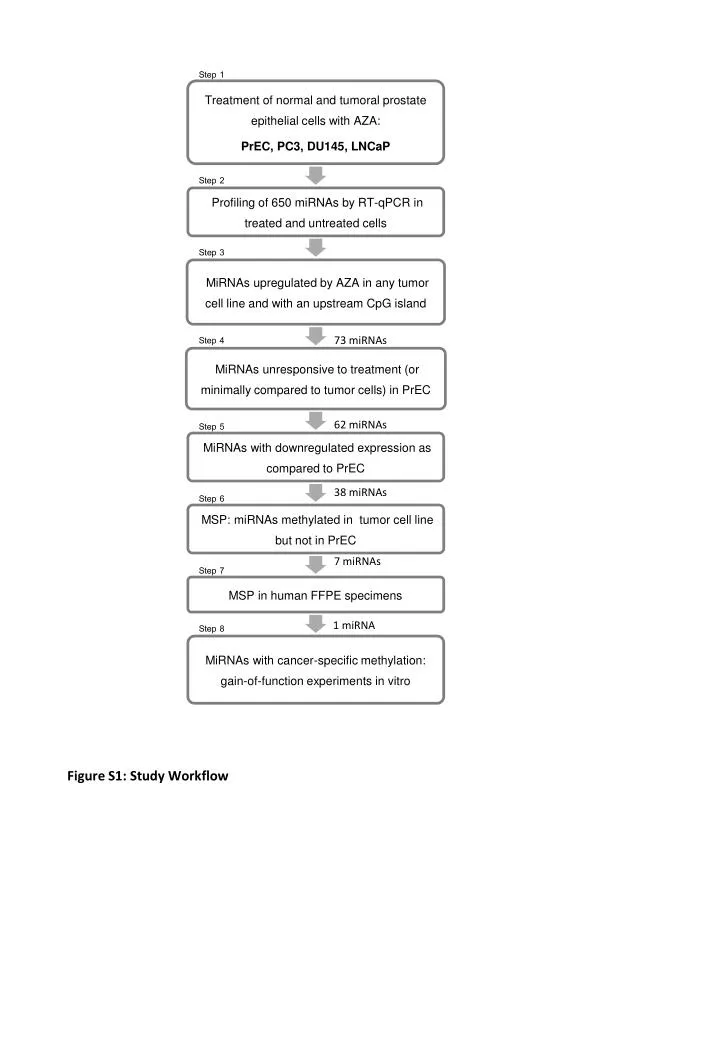
Step 1. Step 2. Step 3. 73 miRNAs. 62 miRNAs. Step 4. 38 miRNAs. Step 5. 7 miRNAs. Step 6. 1 miRNA. Step 7. Step 8. Figure S1: Study Workflow. a . b . c .

E N D
Step 1 Step 2 Step 3 73 miRNAs 62 miRNAs Step 4 38 miRNAs Step 5 7 miRNAs Step 6 1 miRNA Step 7 Step 8 Figure S1: Study Workflow
a b c Figure S2: Candidate reference gene search in vitro and in vivo. (a) Genorm analysis of candidate reference genes across PrEC, PC3, DU145, LNCaP cells untreated and treated with AZA. Candidates included: RNU6B, U18, miR-210, miR-30e-5p, miR-191, miR-197, miR-331 and miR-103. SnoRNAs were employed since they find ubiquitous use as reference genes. MiRNAs 210, 30e-5p, 197 and 331 were chosen according to Mestdagh et al1. MiR-191 and miR-103 were included as per Peltier and Latham2. TaqMan miRNA assays (Applied Biosystems) were employed to measure expression levels by a multiplex RT reaction.The 20uL RT reaction contained the following reagents available in the Taqman miRNA reverse transcription kit (Applied Biosystems): 0.4uL dNTP, 4uL reverse transcriptase, 2uL 10X RT buffer, 0.25uL RNase inhibitor, 20ng RNA and 4uL 5X primer pool. The primer pool consisted of the Taqman RT primers each diluted 1:4 from 250nM to 62.5nM. The 16uL qPCR reaction contained 2X Taqman qPCR master mix, 0.4uL of Taqman probe and 3uL of 5-fold diluted cDNA. Standard curves were done to ensure an amplification efficiency from 90 to 110%. qPCR was carried out on the Stratagene Mx3000P. Data was imported into qBasePLUS (Biogazelle) for geNorm analysis3 and relative quantification. (b) miR-132 expression in cell lines averaged over 3 biological replicates and normalized to the geometric mean of miR-331 and miR-103. R.U. = relative units. (c) GeNorm analysis of candidate reference genes in 20 FFPE prostate specimens consisting of 20 normal and 20 cancerous samples indicates the geometric mean of miR-191 and miR-103 as the optimal normalization factor (same protocol as above).
a b Figure S3: miR-132 expression correlated with tumor stage and Gleason score. Samples (GSE21032)4 were clustered by (a) average Gleason score and (b) pathologically determined stage . Red asterisks indicate average miR-132 expression for each group and dashed line indicates decreasing trend. Pearson correlation coefficients and associated p-valuesare indicated at the bottom left. Overall, the mean miR-132 expression of low Gleason score (≤7) versus high Gleason score (≥8) had a decreasing trend (6.81 versus 6.56; p=0.19 Student’s t-test). High Stage was significantly associated with lower miR-132 expression (p=0.004, Student’s t-test for T2a-T2b versus T3a-4).
a *** *** Control, 72hrs miR-132, 72hrs G1 52% S 29% G2/M 19% G1 52% S 25% G2/M 23% b Necrotic: 1.8% 4.5% Live:95% Apoptotic: 2% 3% 92% Ctrl, 72hrs miR-132, 72hrs c PI Figure S4: Flow cytometric cell cycle and vitality analysis of PC3 cells transfected with a scrambled sequence or premiR-132 at 72 hours. (a) Analysis of PremiR-132 transfection efficiency by RT-qPCR of mature miR-132 at 72 hours. See Figure S1b for procedure.***p-value<0.001, Student’s t-test. (b) Cell cycle analysis at 72 hours post-transfection shows no differences between control and miR-132-expressing cells. Similar results were obtained at 48 hours (data not shown). See Viticchiè et al.5for experimental procedure. (c) Quantitative analysis of cell viability and death by flow cytometric measurement of cellular fluorescence after staining with fluorescein diacetate and propidium iodide on the FacsCalibur flow cytometer (Becton Dickinson)6. The percentages indicate necrotic (top left), apoptotic (bottom left) and live cells (bottom right). Cells were harvested at 72 hours post-transfection and stained for 5’ with propidium iodide and fluorescein DA to a final concentration of 4ug/mL and 100mM, respectively. Fluorescein DA PI
Figure S5: HB-EGF and TALIN2 mRNA expression for 110 prostate cancer tumors4 for which miRNA data was also available. Black bars indicate significant expression modulations at a z-score cutoff of ±2 (dashed line). Data were downloaded from the cBio cancer genomics portal (http://www.cbioportal.org). Significant changes occurred in 7.3% of cases for HB-EGF where 100% of these demonstrated an upregulated expression. For TALIN2, 20.8% of cases had deregulated expression, where 95.6% of these demonstrated an upregulatedexpression.
Supplementary references: Mestdagh P, Van Vlierberghe P, De Weer A, Muth D, Westermann F, Speleman F, Vandesompele J . A novel and universal method for microRNA RT-qPCR data normalization. Genome Biol2009; 10: R64. Peltier HJ, Latham GJ. Normalization of microRNA expression levels in quantitative RT-PCR assays: identification of suitable reference RNA targets in normal and cancerous human solid tissues. RNA 2008; 14: 844-52. Vandesompele J, De Preter K, Pattyn F, Poppe B, Van Roy N, De Paepe A, et al. Accurate normalization of real-time quantitative RT-PCR data by geometric averaging of multiple internal control genes. Genome Biol2002; 3:RESEARCH0034. Taylor BS, Schultz N, Hieronymus H, Gopalan A, Xiao Y, Carver BS et al. Integrative genomic profiling of human prostate cancer. Cancer Cell2010;18:11-22. Viticchiè G, Lena AM, Latina A, Formosa A, Gregersen LH, Lund AH et al. MiR-203 controls proliferation, migration and invasive potential of prostate cancer cell lines. Cell Cycle 2011; 10: 1121-31. Bartkowiak D, Högner S, Baust H, Nothdurft W, Röttinger EM. Comparative analysis of apoptosis in HL60 detected by annexin-V and fluorescein-diacetate. Cytometry1999; 37: 191-6.