Download
1 / 22
220 likes | 380 Views
Changes in Rising and Sinking Air: Adiabatic Processes. Process Lapse Rates

E N D
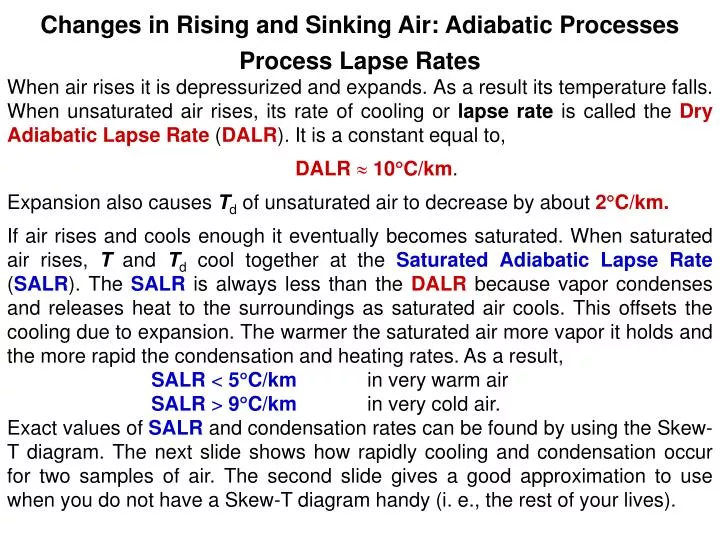
Changes in Rising and Sinking Air: Adiabatic Processes Process Lapse Rates When air rises it is depressurized and expands. As a result its temperature falls. When unsaturated air rises, its rate of cooling or lapse rate is called the Dry Adiabatic Lapse Rate (DALR). It is a constant equal to, DALR10C/km. Expansion also causes Td of unsaturated air to decrease by about 2C/km. If air rises and cools enough it eventually becomes saturated. When saturated air rises, T and Td cool together at the Saturated Adiabatic Lapse Rate (SALR). The SALR is always less than the DALR because vapor condenses and releases heat to the surroundings as saturated air cools. This offsets the cooling due to expansion. The warmer the saturated air more vapor it holds and the more rapid the condensation and heating rates. As a result, SALR <5C/km in very warm air SALR>9C/km in very cold air. Exact values of SALR and condensation rates can be found by using the Skew-T diagram. The next slide shows how rapidly cooling and condensation occur for two samples of air. The second slide gives a good approximation to use when you do not have a Skew-T diagram handy (i. e., the rest of your lives).
The warmer air has a larger mixing ratio that decreases more rapidly while its T decreases more slowly.
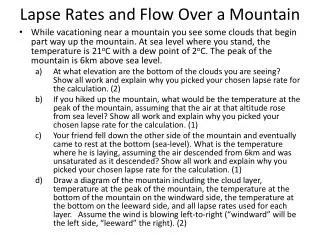
Even though SALR varies, it is useful to approximate it with a typical value, SALR 6C per km. Therefore, use the rules below (illustrated in the diagram to the right) when calculating changes of T and Td when air rises or sinks. Rising Unsaturated Air (T > Td) T cools 10C per km (upward) Td cools 2C per km Rising Saturated Air (T = Td) T and Td both cool 6C per km Sinking Air* T warms 10C per km (downward) Td warms 2C per km (downward) These rules are valid whether air rises vertically in a thunderstorm, or obliquely over a front. *Because most rain and snow fall out of the clouds, little is left to evaporate once air begins to sink. The sinking air then quickly becomes unsaturated. both T and Td then increase at the rates for unsaturated air. On the next two slides we use these rules to find how T and Td change as air passes over a 1: mountain and, 2: a dome of cold air.
3 km 2 km 1 km 0.5 km Here it is necessary to move upwards at ½ km steps The Chinook is a warm, dry downslope wind. It occurs in many mountainous regions but has different local names (Foehn in Germany, Zonda in Argentina, Santa Ana in Los Angeles, etc.). The air on the right ends up warmer and drier than it started on the left because vapor condensed (adding latent heat to the air) and precipitated out of the air when the air rose on the windward side of the mountains.
Height (km) 3.0 2.5 2.0 1.5 1.0 0.5 0.0 T=-2 Td=-2 T=01 Td=01 T=04 Td=04 Frontal Surface T=07 Td=07 T=12 Td=08 T=17 Td=09 T=09 T=06 T=03 T=-1 T=-2 Precipitation Form None R? R ZR, IP S T > 0 at ground so ppt melts T > 0 aloft so ppt melts; T < 0 at ground so ppt refreezes Air aloft unsaturated Air aloft just at LCL. Any ppt is rain because T > 0 at ground T < 0 at all levels so snow never melts Reasons Cross Sections and Precipitation Form As warm and cold air masses converge in low pressure, a front forms at the boundary and the warm air slides over the dome of cold air like a conveyer belt. As we have seen, the form of precipitation depends on T both aloft and at the surface. T aloft is determined by the DALR and SALR as the warm air rises.
When will air rise freely? When it is heated and buoyant and the atmosphere is unstable.
Stability Thunderstorms form when a rising bubble or parcel of air, which is indicated by the process lapse rate, is warmer and hence lighter than the sounding of the surrounding atmosphere. This condition is unstable. On the other hand, vertical motions are suppressed when the rising parcel is colder and denser than the surrounding atmosphere. This condition is stable and leads to polluted air when winds are light and there is a source of pollution. Therefore, Unstable Atmosphere Sounding T decreases faster with height than rising parcel. Stable Atmosphere Sounding T decreases slower with height than rising parcel. Atmospheric stability is determined by the following steps: 1. Draw the sounding. 2. Lift a parcel of air from ground level using the process cooling rate for unsaturated air to the point of saturation and the process cooling rate for saturated air thereafter. 3. Compare temperatures of sounding and lifted parcel. The atmosphere is unstable if the lifted parcel is warmer then the sounding and stable if the lifted parcel is cooler. Sometimes, the lifted parcel will be cooler than the sounding for the first few hundred meters of lifting but warmer at some greater heights. This means that the atmosphere will need a push to get it going. Such an atmosphere is potentially unstable, and the instability will be realized only if the air near the ground is heated further, or if some atmospheric process forces the entire atmosphere to rise. Examples of forced rising include upslope flow against mountains or over frontal surfaces.
When rising air crosses the tropopause it becomes colder than the surroundings, and sinks back to its equilibrium level TROPOPAUSE Thunderstorms form when T of the surrounding atmosphere falls more rapidly with height than T of the rising air from near ground level. This is an atmosphere with an unstable lapse rate. Slightly Hotter Ground
1 km 15 20 15 22 20 22 Stability Exercises If a person is disturbed – given a push – and is not fazed by it, that person is stable. Similarly, if a balloon or parcel of air is given a push upwards and sinks back to the original level it is stable. But if the parcel accelerates up after the initial upward push it is unstable. The procedure to determine stability is: 1. Lift the air parcel 1 km, changing its T by the DALR if it is unsaturated and by the SALR if it is saturated. 2. Compare T of the parcel to T of the environment at the same height (1 km). If the lifted air parcel is warmer (colder) than its new environment at 1 km it will be lighter (denser) and will accelerate up (down). This situation is unstable (stable). 0 km T = 30 Td = 10 30 Td = 10 T = 30 30 The atmosphere to the left (right) is unstable (stable) because the lifted parcel is warmer (colder) than the surroundings. In both cases the rising, unsaturated air cooled at the same rate (the DALR) because it is governed by a PROCESS while the surroundings differed because they represent changeable SITUATIONS.
Stability and Inversions Inversions indicate extremely stable situations. Cold air below is much too dense to rise, while warm air above is much too light to sink. Inversions are associated with air pollution outbreaks (especially when winds are light or calm) precisely because pollutants cannot be dispersed aloft unless the wind is very strong. Inversions can be destroyed by heating the air below. This happens almost every clear day near the ground. Overnight the ground cools and an inversion forms in the lowest few hundred meters of the atmosphere. The rising sun heats the ground, which heats the air near the ground until it becomes warmer than the air above and rises. This destroys the inversion, disperses pollutants upward and may even sprout cumulus or thunderstorms. Subsidence Inversion Fog or Low Stratus
The Skew_T Log_ p Diagram Thermodynamic diagrams are graphical computers for calculating adiabatic processes and resulting changes of temperature and humidity. (The first such diagram was created by James Watt, to calculate changes of pressure and temperature in the steam engine as water boiled and as steam condensed!) TheSkew-Tis the standard thermodynamic diagram used by meteorologists. It was designed to depict most soundings as more or less vertical lines. In the typical sounding diagram the x axis represents temperature and the y axis represents height or some function of decreasing pressure. Therefore, isotherms or lines of constant T are vertical lines while isobars or lines of constant pressure are horizontal lines. But T decreases so drastically with height in the troposphere, that the only way to depict atmospheric soundings as more or less vertical lines is to make isotherms slope up to the right. This is what makes theSkew-T so useful to meteorologists but so difficult to learn to read. The following slides show how the Skew-T is designed and how it acts as a process calculator.
Isobar p Isotherm T Mixing Ratio w Dry Adiabat q Moist Adiabat qe
Skew-T Diagram of Sounding of a Snowstorm at Upton, NY Td T Inversion
Now let us use the SKEW-T as a calculator Isobar p Isotherm T Mixing Ratio w For air starting at p = 1000 hPa, T = 25C, Td = 0C, find the 1. Mixing Ratio, w 2. Saturated Mixing Ratio, ws 3. Relative Humidity, RH 4. Lifting Condensation Level, LCL Dry Adiabat q Moist Adiabat qe LCL
For air starting at p = 1000 hPa, T = 25ºC, Td = 0ºC and rising to p = 300 hPa, find 1. T 2. Mixing Ratio, w 3. Amount of Condensed Vapor 4. Wet Bulb Temperature, Tw Isotherm T Mixing Ratio w Isobar p Dry Adiabat q Moist Adiabat qe LCL Td T
Solutions 1. Lifting Condensation Level (LCL) = 690 hPa 2. w = 3.8 ppt ws = 22 ppt 3. RH = w/ws = 3.8/22 = 17 % 4. Tw = 11oC 5. At 300 hPa, T = -50.5oC, w = 0.12 ppt, Dw = 3.68 ppt Isotherm T Mixing Ratio w Isobar p Dry Adiabat q Moist Adiabat qe Run SKEW_T LCL Td Tw T
The Lifted Index (LI) gives a simple measure of the degree of instability. Lift air from the surface to 500 hPa. Subtract Tpar of the lifted parcel from Tenv of the environment or sounding (LI = Tenv-Tpar). The warmer the parcel compared to the environment the greater the instability and the more negative LI. A parcel accelerates upward so long as it is warmer than the environment (indicated by the green area). Once the rising parcel is colder than the surroundings, it will slow. Cloud top occurs where the negatively buoyant purple area is about half the buoyant green area.
Example of the Lifted Index Lift air from p = 1000 hPa, T = 25oC, Td = 0oC to 500 hPa. Find the LI. Lifted Index T500 - TLP = -16 - (-22) = 6 The Lifted Parcel is colder than the surroundings or sounding (thick black line). LI is positive and the air is stable. No convective showers or thunderstorms will occur. Sounding T Sounding Td TLP T500 Td T
Sparking Convection Thunderstorms are children of the afternoon. The air near the ground cools at night, stabilizing the morning sounding. But since the air more than 50 or 100 hPa above ground level changes little from day to night (aside from changes due to wind) the sounding provides crucial information about the probability, timing, and intensity of thunderstorms later in the day. The Convective Temperature (TC) is the minimum surface temperature to start convection and the Convective Condensation Level (CCL) is the level of the cloud base once the surface air warms to TC. The pink area is proportional to the heat that must be added to reach TC. CCL TC
Convective Available Potential Energy Convective Inhibition CAPE or Convective Available Potential Energy isthe maximum energy available to a rising air parcel in an unstable atmosphere. It is proportional to the green area between the Temperature of the Lifted Parcel and the Temperature of the Sounding of the next slide. Values of CAPE greater than 1500 indicate strong thunderstorms are possible. CIN or Convective Inhibition is the energy an air parcel near ground level needs to reach the Level of Free Convection (or level above which a rising parcel becomes warmer than the surrounding air – indicated by the red circle). Often in the morning the air near the ground is stable and restricts convection. Only when the Sun heats the air enough or when large scale motions lift the air enough is CIN eliminated. Then convection starts.
Isotherm T Mixing Ratio w CAPE Dry Adiabat, q Isobar p Moist Adiabat Level of Free Convection CIN T Td