Download
1 / 16
160 likes | 255 Views
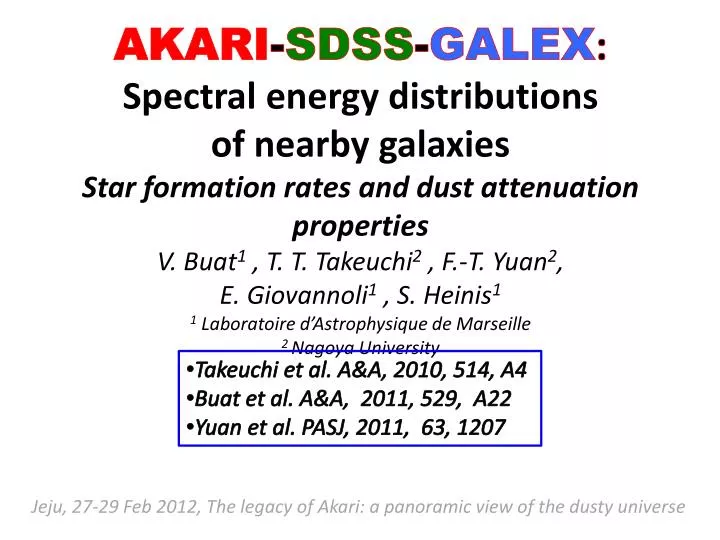
AKARI - SDSS - GALEX : Spectral energy distributions of nearby galaxies Star formation rates and dust attenuation properties V. Buat 1 , T. T. Takeuchi 2 , F.-T. Yuan 2 , E. Giovannoli 1 , S. Heinis 1 1 Laboratoire d’Astrophysique de Marseille 2 Nagoya University.

E N D
AKARI-SDSS-GALEX:Spectral energy distributions of nearby galaxiesStar formation rates and dustattenuationpropertiesV. Buat1 , T. T. Takeuchi2 , F.-T. Yuan2, E. Giovannoli1 , S. Heinis11 Laboratoire d’Astrophysique de Marseille2 Nagoya University • Takeuchi et al. A&A, 2010, 514, A4 • Buat et al. A&A, 2011, 529, A22 • Yuan et al. PASJ, 2011, 63, 1207 Jeju, 27-29 Feb 2012, The legacy of Akari: a panoramicview of the dustyuniverse
Outline • Samplesdefinition • SED fitting on multi-λ data • Dustattenuationrecipes • Green valley galaxies • SFR calibrations
Sampleselections AKARI FIS all skysurvey FIS Bright Source Catalogue Xmatchedwith IRAS PSCz + SDSS/DR7 and GALEX/GR4-5 surveys 2MASS data alsoadded Primarysample: 776 galaxies selectedat 90 µm: (Takeuchi et al. 2010) 363 galaxies all detected 153 galaxies Xmatched at 140 µm with AKARI/IRC PSC (Buat et al. 2011) (Yuan et al. 2011) and poster 2-21 for details
SED fittingwith CIGALE Reliability of SED fittingresultschecked on artificial galaxies: Buat et al. 2011
Parameter estimation Star formation history Dustemission Dustattenuation
Dustattenuation Takeuchi et al. 2010, Buat et al. 2011
Dale et al. 07 SeealsoBoissier et al. 07 Munoz-Mateos et al. 09 The slope of the UV continuum: a measuredustattenuation? f(1200-2500Å), : a proxy for dustattenuation in local starburst galaxies observed by IUE and IRAS Meurer et al. 95, 99, Calzetti et al. 00 SINGS
AKARI-SDSS-GALEX: a very large dispersion AFUV (fromLir/LUV)mag o LIRGs __ Meurer et al 99 Seibert et al. 05 - - Salim et al 07 Takeuchi et al. 10 Buat et al. 2011 AKARI-SDSS-GALEX data + SED fitting Verydispersed relations FUV-NUV a proxy for ß seealsoHowell et al 2010, Goldader et al. 2002, Buat et al. 2005, Seibert et al. 05 Munoz-Mateos et al. 09, Overzier et al. 10 etc…
UV-opticalcolours are onlycrudeestimators of dustattenuation FUV-NUV FUV-r AFUV = 2.39 (FUV-NUV)+0.89 (σ = 0.83) σ(FUV-NUV) = 0.2 mag σ(AFUV) = 0.5 mag AFUV = 0.65 (FUV-r)+0.04 (σ = 0.76) σ(FUV-r) = 0.2 mag σ(AFUV) = 0.1 mag colour Seealso Johnson et al. 2007
Green valley: star formation and dustattenuationTakeuchi et al. 2010, Heinis et al. in prep Blue cloud star forming galaxies NUV-r < 3.5 Redcloud, quiescent galaxies NUV-r > 4.7 Green valley 3.5<NUV-r<4.7
Galaxies in the green valley: Distributions of D4000 and SSFR close to those of the bluecloud galaxies but with a tailtowards quiescent galaxies. The galaxies in the green valley have largerattenuationsthanblue galaxies On goingwork
SFR calibrations Buat et al. 2011: CombiningIR and UV data Yuan et al. 2011: Calibration of MIR fluxes
AddingUV and IR measurements to estimate the SFRs Buat et al. 11 • SFR(Msun yr-1) = (1-) SFR(IR)+SFR(UVobs) • SFR(IR) and SFR(UV) fromrecipes (e.g. Kennicutt 98) • corresponds to the fraction of L(IR) due to the heating by old stars • Hirashitaet al. 03, Iglesias-Paramo et al. 04,06, Bell 03 = 0.3-0.4 (star forming galaxies) η= 0.17 +/- 0.10
MIR luminositiescalibrated in SFRs Yuan et al. 2011 logSFR18 = 0.90 log(L18)-8.03 (σ=0.20 dex) logSFR9 = 0.99 log(L9)-9.02 (σ=0.18 dex)
Comparisonwith calibrations fromSpitzer Fluxes at 8 and 24 µm from the best model (Dale and Helou 02 templates) AKARI Log(SFR8/SFR9) = -0.14 +/- 0.18 (Wu et al) Log(SFR8/SFR9) = -0.25 +/- 0.16 (Zhu et al) Log(SFR24/SFR18) = -0.01 +/- 0.12 (Wu et al) Log(SFR24/SFR18) = -0.05 +/- 0.11 (Zhu et al) Log(SFR24/SFR18) = -0.04 +/- 0.17 (Rieke et al)
Conclusions • Referencesamplesbased on a FIR selection and with large wavelengthcoverage. • Reliable SFR and dustattenuationretrievedfrom SED fitting, calibrations investigated. • Green valley galaxies easilyidentified: combination of dusty « bluecloud » galaxies and more quiescent objects • Sampleswhichcanbeused for comparison in high z studies: Elbaz et al., Wang et al. (similarsamples) Symeonidis et al (in prep)