Download
1 / 15
150 likes | 298 Views
Colored Goldfish. By Michael & Bobby. Why Colored Goldfish. Why Preconceived notions. Data. Collection Univariate Number of data points. Pie Chart. Dot Plot. Box and Whisker. Histogram. Stem & Leaf. Measure of Center. Alignment Outliers. Measure of Dispersion. IQR Fences

E N D
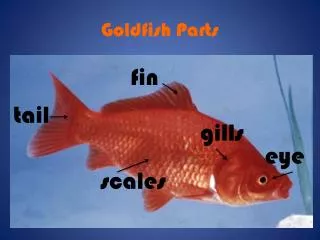
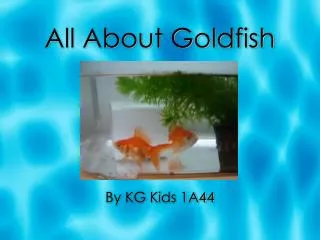
Colored Goldfish By Michael & Bobby
Why Colored Goldfish • Why • Preconceived notions
Data • Collection • Univariate • Number of data points
Measure of Center • Alignment • Outliers
Measure of Dispersion • IQR • Fences • Outliers
Cheb/Empirical Rule • Graph • Empirical Rule • Cheb Rule
Z-Score • Meaning • Yellow: 1.47 • Green: -.238 • Orange: -.581 • Red: -.655
Distribution • Graphs • Mean, Median, Mode
Bibliography • Rainbow Colored Goldfish Crackers. Digital image. Infinite Flower. Wordpress.org. Web. 4 Nov. 2011. <http://www.infiniteflower.com/not-hungry/>. • Luca, Andrei. Goldfish. Digital image. Mesh Labs Study: Colored Goldfish. Wordpress Light Word Theme. Web. 7 Nov. 2011. <http://meshlabs.net/2008/11/mesh-labs-study-colored-goldfish-crackers/>.