Download
1 / 106
1.06k likes | 1.21k Views
PVAAS Overview: Evaluating Growth, Projecting Performance. PVAAS Statewide Core Team Fall 2011. Partners & Teams for Session Activities. The activities throughout the session will be completed in pairs or small groups, while others will be done independently.

E N D
PVAAS Overview:Evaluating Growth,Projecting Performance PVAAS Statewide Core Team Fall 2011
Partners & Teams for Session Activities • The activities throughout the session will be completed in pairs or small groups, while others will be done independently. • Take a few minutes now to divide yourselves into: • Partners (groups of 2), AND • Small groups (groups of 4-6).
Session Workbook • Workbook contains: • Key notes from PowerPoint • Session activities • Yellow boxes on PPT slides indicate the page number(s) you should be referencing in your workbook.
WB P. 1 Goal of Session By the end of the session, participants will be able to answer the following questions: • What is PVAAS? How does PVAAS measure growth? • What does PVAAS tell us about growth in our district and school? • What does PVAAS tell us about how students are projected to perform on a future PSSA? • Which reports are most meaningful for school level planning, grade level planning and student level planning?
WB P. 1 Agenda Pre-test What is PVAAS? PVAAS Value-added Reports Going Deeper with Value-added PVAAS Projections Projection Summaries PVAAS Help Menus and Podcasts Post-test
WB P. 2 PVAAS Overview Pre-test! Complete Independently
WB P. 3 What Is PVAAS?
WB P. 3 PVAAS IS: • Analysis of existing assessment data • Longitudinal PSSA scores in available content areas • Math, Reading, Science, Writing • Provides reliable estimates • A measure of a school’s effectiveness and growth over time. • Critical Relationship: Growth Data vs. Achievement Data
WB P. 3 PVAAS: • Is not another test • Critical concept: Is not a comparison of single test scores
WB P. 3 Review of Literature Is there a relationship between: • Demographics vs. Achievement? • Demographics vs. Growth? Demographics are inherently controlled for in PVAAS by the use of all longitudinal data on all students.
WB P. 4 Summary and Reflections Work with a partner to complete the activity
WB P. 4 Summary and Reflections Answers
WB P. 5 Current Data Collection Approaches High Achievement Average Achievement Low Achievement Achievement is based on each student’s ending point.
WB P. 5 PVAAS Adds Another Variable To Achievement…GROWTH! Below Standard for PA Academic Growth Above Standard for PA Academic Growth Progress is based on each student’s starting point.
WB P. 5 Take notes on page 5of your workbook using the information on the next slides
WB P. 5 The Scatter Plot Coordinate System Vertical Axis PSSA Percent Proficient or Advanced Standard for PA Academic Growth Boundary AYP Percent Proficient Target Horizontal Axis PVAAS Growth Index
WB P. 5 Scatter Plot Quadrants and Their Meanings Quad 2 - Slipping Adequate Achievement Negative Growth Quad 1 - Excelling Adequate Achievement Positive Growth Quad 4 - Improving Below Adequate Achievement Positive Growth Quad 3 - Underperforming Below Adequate Achievement Negative Growth
WB P. 6 Interpreting Scatter Plots Work with your partner to review either scatter plot A or scatter plot B. Fill-in strengths and weaknesses of the scatter plot (A or B) on page 8 of your workbook. Remember, each “dot” represents a school! We will discuss as a group…“What can you conclude by looking at both?”
WB P. 6 Example: District Scatter Plot A Note: Each dot on the scatter plot represents a school from this district.
WB P. 6 Example: District Scatter Plot: Same Schools, Different Subject B Note: Each dot on the scatter plot represents a school from this district.
WB P. 7 NEW! Web-Based Scatter PlotsPage 7 in your workbook.
WB P. 7 Web-based Scatter Plots
WB P. 7 Web-based Scatter Plots! • Users may choose to plot different variables with achievement and/or growth! • This includes demographics such as: • % Tested Economically Disadvantaged • % Tested Limited English Proficiency • % Tested Special Education • % Tested Minority
WB P. 7 Example
WB P. 8 Summary and Reflections Work independently to complete the Summary and Reflections page in your workbook.
WB P. 9 TWO Types of PVAAS Information Looking Forward/Planning… PVAAS Projection Reports For Individual Students and Groups of Students Looking Back/Evaluation… Value-added Growth Reports For Groups of Students Today
WB P. 9 PVAAS Value-Added ReportingHow is growth measured in PVAAS?
WB P. 9 Value-added Wouldn’t it be great to know if your district/school met the standard for PA Academic Growth for students tested in grades 4-8? And in grades 9-11?
WB P. 9 PVAAS Growth Methodologies
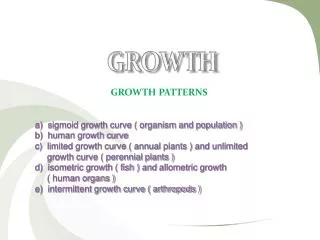
WB P. 10 Growth Charts
WB P. 10 Growth Charts Percentile Bands 3rd-15th-50th-85th-97th Vertical Axis Length (cm) Horizontal Axis Age (months - years
WB P. 10 Growth Charts
WB P. 10 Concept of GrowthGrowth Standard MethodologyGrades 4–8, Math and ReadingComplete the activity on page 10 in your workbook.
WB PP. 10 & 11 Growth Chart Activity
WB P. 11 One example of a growth spurt from 6 months to 18 months One example of less than typical growth from 6 months to 18 months X X X X
A Challenge to Comparing Scores Across Years • The means and standard deviations of PSSA exams change every year. • A score of 1300 can be above the state mean one year and below it in another. • Solutions – rescaling using a Normal Curve Equivalent Scale (NCE). • Rescales all tests to have a state mean of 50 and standard deviation of 21.06.
Example of RescalingGrades 4-8: Math & Reading • 0 10 20 30 40 50 60 70 80 90 100 NCE Units 1000 1100 1200 1300 1400 1500 Scaled Score Units
WB P. 12 Growth Standard MethodologyGrades 4 through 8 – Reading & MathA group of students makes one year’s growth when… The group maintains their relative achievement level from one year to the next in relation to the statewide distribution (2006 baseline). 4th NCE Distribution 2006 Group’s Position – Last Year 5th NCE Distribution 2006 Group’s Position – This Year Note: A dot represents a school.
WB P. 12 Complete the calculation in your workbook using the information on the next slide.
WB P. 12 What Value-Added Growth Means!Growth Standard MethodologyGrades 4-8, Reading and Math Achievement 6th grade 52.7 Achievement 5th grade 47.6 0 10 20 30 40 50 60 70 80 90 100 NCE Scale State Mean = 50 PVAAS Growth ≈ Change in position from 5th to 6th grade ≈ 52.7 – 47.6 ≈ 5.1 NCE units
WB P. 13 Complete “Check for Understanding” • Complete independently • or with your partner
WB P. 13 Example of Growth Measure=0 for a low-achieving district/school Example of Growth Measure=0 for a high-achieving district/school
WB P. 13 Example of negative growth for a district/school
WB P. 14 Answer the questions on page 14 with your partner.
WB P. 14 Value-added Measure ofGrowthGrades 4-8 Reading and Math Comparison to a State Growth Standard The Growth Standard specifies the minimal acceptable academic gain from grade to grade for a group of students. The use of a Growth Standard creates the possibility that ALL schools can demonstrate appropriate growth.
WB P. 15 NEW! Legends and Color Codes • Alignment of colors and interpretative legends across all Value-Added Reports (all subjects and grade levels) • New 5 color-coding scheme • All colors now have the same interpretation and meaning • Use of the data becomes easier as there is no confusion about what the colors indicate • New 5 Color Codes • Allow for more differentiation among schools making a year’s worth of academic growth or more • Allow for more differentiation in Science and Writing reporting, as well as grades 9-11 Reading and Math reporting
WB P. 15
WB P. 15 NEW! PVAAS Value-addedGrowth Descriptors Grade 4-8, Math and Reading