Download
1 / 27
270 likes | 464 Views
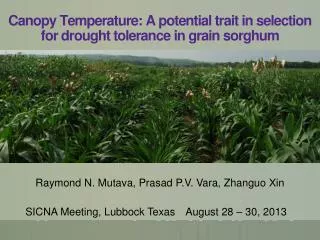
Predicting Grain Yield Potential Using Corn Hybrids Having Improved Drought Tolerance. Eric C. Miller Jeremiah L. Mullock , Jacob T. Bushong , and William R. Raun NUE Conference Sioux Falls, SD August 5 th , 2014. Drought.

E N D
Predicting Grain Yield Potential Using Corn Hybrids Having Improved Drought Tolerance Eric C. Miller Jeremiah L. Mullock, Jacob T. Bushong, and William R. Raun NUE Conference Sioux Falls, SD August 5th, 2014
Drought • The 2012 drought, 597 counties in 14 states primary natural disaster areas (USDA, 2013). • $14 billion in crop insurance indemnity payments (Congressional Budget Office, 2013).
Drought effects on corn Figure adapted from Nielsen, 2007
Transgenic trait/GMO • Cold shock protein B gene • Called ‘cspB’ • Bacillus subtilisbacterium • Cold shock proteins accumulate • Act as RNA chaperones • Bind and unfold tangled RNA molecules to promote normal function(Castiglioni et al., 2008) http://www.lhsc.on.ca/_images/Genetics/centraldogma.jpg
Conventional breeding • Express native drought tolerant traits using marker assisted selection (Butzen and Schussler, 2009)
OSU grain yield prediction approach • YP0 (kg ha-1) = 1291exp[(NDVIFP/Cumulative GDD)*2649.9] • GDD = [(TMax+Tmin/2)–Tbase • 10 oC and 30 oC are threshold values • RI = NDVIN-Rich/NDVIFarmerPractice • YPN(Mg ha-1) = YP0*RI • N Rate (kg ha-1) = YPN-YP0*0.0125/NUE
Objective • Evaluate grain yield potential • Drought tolerant and less drought tolerant corn hybrids • Irrigated and rainfedproduction systems
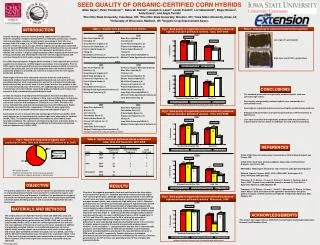
Experiment sites • Established in 2013 and has continued in 2014 • 3 replicates • 4 row plots, 6.1 m long • Soils: • Efaw • Norge: Fine-silty, mixed, active, thermic UdicPaleustolls • Lake Carl Blackwell (LCB) • Port: Fine-silty, mixed, superactive, thermic CumulicHaplustolls, Oscar: Fine-silty, mixed, superactive, thermic, TypicNatrustalfs Efaw LCB
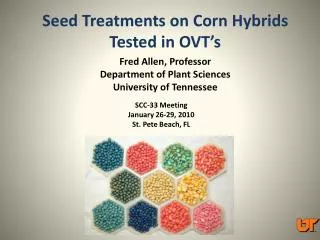
Experimental design: GxExM • Genetics • Drought tolerant • Pioneer P1498: Optimum AQUAmax • Monsanto63-55: Droughtgard • Less drought tolerant • Pioneer P1395 • Monsanto 62-09 • Environment xManagement Photo Courtesy of Jacob Bushong • Rainfedproduction system • Preplant N rates • 0, 67, and 134 kg ha-1 • Seeding rate • 53,800 seeds ha-1 • Irrigated production system • Preplant N rates • 0, 101, and 202 kg ha-1 • Seeding rate • 75,650 seeds ha-1
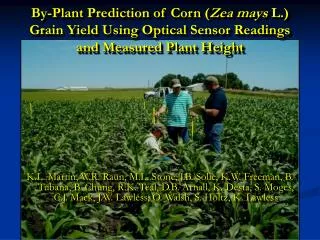
Data collection • NDVI collected with Trimble GreenSeeker optical sensor • V8 and V10 • Grain yield (kg ha-1) • Center two rows per plot • Adjusted to 155 g kg-1 moisture http://web.extension.illinois.edu/nwiardc/eb270/20121015_6040.html
Potential grain yield : V8-V10 = Current YP0 equation
Grain yield by hybrid Drought tolerant
Conclusions • Few differences existed between DT and non-DT corn hybrids when predicting potential grain yield • Clear differences were detected between irrigated and rainfed production systems • Potential grain yield was over-predicted
Evaluation of the Trimble Experimental Sensor Eric C. Miller Jeremiah L. Mullock, Jacob T. Bushong, and William R. Raun NUE Conference Sioux Falls, SD August 5th, 2014
Appearance Trimble Experimental Sensor GreenSeeker
Sensor footprint – 36” high 30” 36” Trimble ExperimentalSensor 15” GreenSeeker ¾”
Data storage and processing • Recon or Nomad • vxHpc - hyperterminal program • Reflectance of red and NIR bands individually • Microsoft Accessdata query • Calculate NDVI • Plot averages
Research question • How does NDVI660 collected with the Trimble Experimental Sensor relate to GreenSeekerNDVI660? Data collection • 2013 and 2014 • Wheat • Feekes 3 to 9 • Corn • V6 to V12 Photo Courtesy of Jeremiah Mullock
Conclusions • Overall, good relationship between the GreenSeeker and Trimble experimental sensor • Clear differences between crops • Possible need for a calibration for corn to utilize current algorithms • Further evaluation of high biomass corn data