Download
1 / 72
720 likes | 835 Views
Detecting topological patterns in protein networks. Sergei Maslov Brookhaven National Laboratory. What defines a complex system?. Complex system has many interacting components (10 11 neurons, 10 4 types of proteins, 10 6 routers, 10 9 web pages)

E N D
Detecting topological patterns in protein networks Sergei Maslov Brookhaven National Laboratory
What defines a complex system? • Complex system has many interacting components (1011 neurons, 104 types of proteins, 106 routers, 109 web pages) • All components are different from each other • Systems traditionally studied by physics also have many interacting components (1023 electrons in a superconductor) • But they are all the same!
Networks in complex systems • The simplest question about a complex system: who interacts with whom? • The answer can be visualized as a network • Network is the backbone of a complex system
Why study the topology of complex networks? • Lotsof easily available data: that’s where the state of the art information is (at least in biology) • Large networks may contain information about basic design principles and/or evolutionary history of the complex system • This is similar to paleontology: learning about an animal from its backbone
Complex networks are the right description when things areinterconnected
Internet From Y. Tu, “How robust is the Internet?” , Nature 406, 353 (2000)
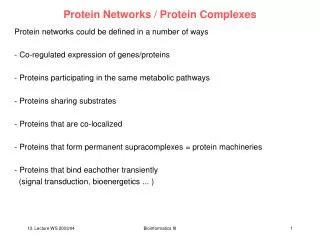
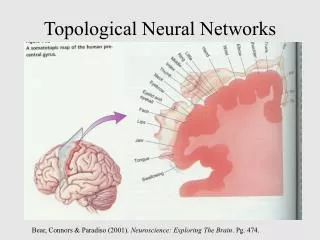
Hierarchy of bio-networks • Metabolic network: production of necessary chemical compounds • Binding network: enzymes bind to their substrates in a metabolic network and to other proteins to form complexes • Regulatory network: turns on and off particular groups of proteins in response to signals • HIGHER LEVELS: cell-to cell communication (e.g. neurons in a brain), food webs, social networks, etc.
Transcription regulatory networks Prokaryotic bacterium:E. coli Single-celled eukaryote:S. cerevisiae
General properties • Densely interconnected • Not very modular: functional modules talk to each other • Have many random features • Few proteins (hubs) interact with a lot of neighbors: but most – with just one
Out-degree Kout=5 In-degree Kin=2 in- and out-degree of nodes
from Stover et al., Nature (2000) Fraction of transcriptional regulators in bacteria
Complexity of regulation grows with complexity of organism • NR<Kout>=N<Kin>=number of edges • NR/N= <Kin>/<Kout> increases with N • <Kin> grows with N • In bacteria NR~N2 (Stover, et al. 2000) • In eucaryots NR~N1.3 (van Nimwengen, 2002) • Networks in more complex organisms are more interconnected then in simpler ones • Life is not just a bunch of independent modules!
Complexity is manifested in Kin distribution E. coli vs. S. cerevisiae vs. H. sapiens
central (hierarchical) peripheral (anti-hierarchical) Central vs peripheral network architecture random From A. Trusina, P. Minnhagen, SM, K. Sneppen, Phys. Rev. Lett. (2004)
Correlation profile • Count N(k0,k1) – the number of links between nodes with connectivities k0 and k1 • Compare it to Nr(k0,k1) – the same property in a randomnetwork • Qualitative features are very noise-tolerant with respect to both false positives and false negatives
Correlation profile of the protein interaction network R(k0,k1)=N(k0,k1)/Nr(k0,k1) Z(k0,k1)=(N(k0,k1)-Nr(k0,k1))/Nr(k0,k1) Similar profile is seen in the yeast regulatory network
Some scale-free networks may appear similar In both networks the degree distribution is scale-free P(k)~ k- with ~2.2-2.5
But: correlation profiles give them unique identities Protein interactions Internet
Null-model of a network • Distribution of degrees is non-random: the degree of every node has to be conserved in a random network • Other topological properties may be also conserved as well: • The extent of modularity (by function, sub-cellular localization, etc.) • Small motifs (e.g feed-forward loops)
given complex network random Randomization
Edge swapping (rewiring) algorithm • Randomly select and rewire two edges • Repeat many times SM, K. Sneppen, Science (2002)
Metropolis rewiring algorithm “energy” E “energy” E+E • Randomly select two edges • Calculate change E in “energy function” E=(Nactual-Ndesired)2/Ndesired • Rewire with probability p=exp(-E/T) SM, K. Sneppen: preprint (2002),Physica A (2004)
Pair of duplicated proteins Pair of duplicated proteins Shared interactions Shared interactions Gene duplication Right after duplication After some time
Yeast regulatory network SM, K. Sneppen, K. Eriksen, K-K. Yan 2003
Network properties of self-binding proteins AKA homodimers
There are just TOO MANY homodimers • Null-model • Pself ~<k>/N • Ndimer=N Pself= <k> • Not surprising as • homodimers have many functional roles
Likelihood to self-interact vs. K Fly: two-hybrid data Human: database data Pself~0.003, Pothers~0.0002 Pself~0.05, Pothers~0.0002
What we think it means? • In random networks pdimer(K)~K2 not ~K like our empirical observation • K is proportional to the “stickiness” of the protein which in its turn scales with • the area of hydrophobic residues on the surface • # copies/cell • its’ popularity (in datasets taken from databases) • etc. • Real interacting pair consists of an “active” and “passive” protein and binding probability scales only with the “stickiness” of the active protein • “Stickiness” fully accounts for higher than average connectivity of homodimers
Summary • Living cells contain many complex protein networks • Networks in more complex organisms are more interconnected • Most have hubs – highly connected proteins • Hubs often avoid each other (networks are anti-hierarchical) • Networks evolve by gene duplications • There are many self-interacting proteins. Probability to self-interact linearly scales with the degree K.
Collaborators: • Kim Sneppen – U. of Copenhagen • Kasper Eriksen – U. of Lund • Koon-Kiu Yan – Stony Brook • Ilya Mazo, Jaroslav Ispolatov, Anton Yuryev – Ariadne Genomics
Protective effect of duplicates Maslov, Sneppen, Eriksen, Yan 2003 Gu, et al 2003Maslov, Sneppen, Eriksen, Yan 2003 Yeast Worm
Protein interaction networks SM, K. Sneppen, K. Eriksen, K-K. Yan 2003
What shapes the topology of protein networks? • Duplication-divergence modelsCANaccount for their basic topological features • BUT: functional organization dominates: • Most pairs with many shared interactions are NOT homologs • Hubs are not caused by mult. duplications • Functional organization is more important than duplication-divergence
Genome-wide protein networks • Nodes - proteins • Edges – interactions between proteins • Bindings (physical interactions) • Regulations (transcriptional, protein modifications, etc.) • Etc, etc, etc.
Correlation profile of the yeast regulatory network R(kout, kin)=N(kout, kin)/Nr(kout,kin) Z(kout,kin)=(N(kout,kin)-Nr(kout,kin))/ Nr(kout,kin)
YPD full regulatory network O <-2 standard deviations O > 2 standard deviations