Download
1 / 4
60 likes | 160 Views
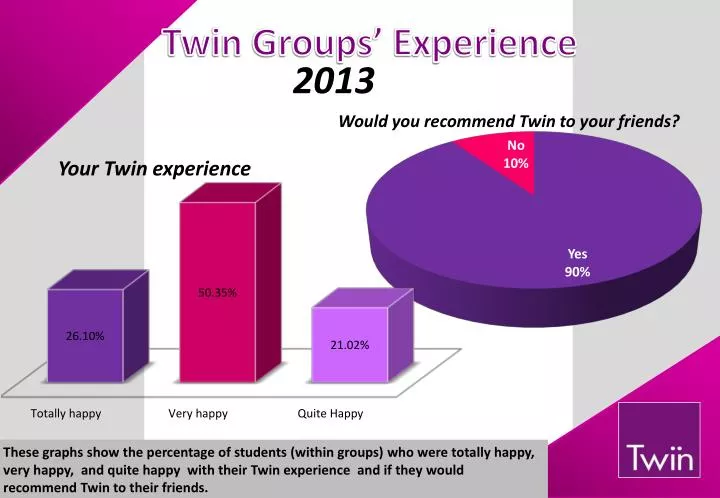
Twin Groups’ Experience . 2013. Would you recommend Twin to your friends?. Your Twin experience. These graphs show the percentage of students (within groups) who were totally happy, very happy, and quite happy with their Twin experience and if they would recommend Twin to their friends. .

E N D
Twin Groups’ Experience 2013 Would you recommend Twin to your friends? Your Twin experience These graphs show the percentage of students (within groups) who were totally happy, very happy, and quite happy with their Twin experience and if they would recommend Twin to their friends.
Happy Students in Groups’ 2013 This graph shows the percentage of students (within groups) who were totally happy, very happy and quite happy with their learning experience (teacher, course book/ materials, progress).
Twin e-Learning (TeL) and Self-Study Centre - Groups 2013 This graph shows the percentage of students (within groups) who were totally happy, very happy, and quite happy with TeL and the Self-study centre.
Social Programme - Groups 2013 This graph shows the percentage of students (within groups) who were totally happy, very happy, or quite happy with the social programme.