Download

1 / 19
190 likes | 278 Views
Monday, September 26 th. Warm-UP. Please complete warm up and write down the Math Homework. Solve 3x=12 Find the pattern 11, 14,17,20……. Reteach/Retest. Reteach: T omorrow morning Retest: Wednesday Morning. Joke of the Day. What do you give to an injured pig? Oink- ment.

E N D
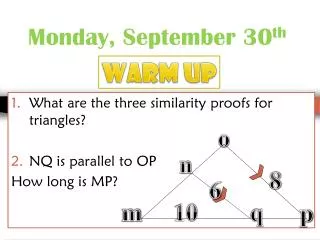
Monday, September 26th Warm-UP Please complete warm up and write down the Math Homework Solve 3x=12 Find the pattern 11, 14,17,20……
Reteach/Retest • Reteach: Tomorrow morning • Retest: Wednesday Morning
Joke of the Day What do you give to an injured pig? Oink-ment
Weekly Review Answers Algebra • 3 • 17 • 468 • 66
Weekly Review Answers Expressions to word • 3 times 6, the product of 3 and 6 • 4 minus 2, 2 less than 4, the difference of 4 and 2 • x plus 100, the sum of x and 100 • x divided by 9, the quotient of x and 9
Weekly Review Answers Standand and exponential • 5^3, 125 • 2^2 x 4^3, 256 • 3^2, 9 • 6^3, 216
Weekly Review Answers Evaluating • 11 • 54 • 66.5 • 8
Weekly Review Answers Decimals • 2 x 2 = $4 • about 5.65 • About $6 • 2.832
New Weekly review Due Friday
Review Complete the “Homeowrk and Practice” for Bar Graphs and Histograms
Graph #3 Circle Graphs
What is it? A circle graph, also called a pie chart, shows how a set of data is divided into parts. • The entire circle contains 100% of the data. Eachsector, or slice, of the circle represents one part of the entire data set.
Example #1 • Which group of echinoderms includes the fewest number of species? • Sea Lilies and feather stars
about , so approximately 33% 1 3 Example #2 Use the circle graph to answer the question. Approximately what percent of echinoderm species are brittle stars and basket stars?
Luxury Large Midsize Small Example #3 Use the circle graph to answer each question. Which size car sold the most? Approximetely what percent does it represent?
Example #4 Leon surveyed 30 people about pet ownership. The circle graph shows his results. Use the graph to answer each question. How many people own dogs only? The circle graph shows that 20% of the 30 people own dogs only. 20% of 30 = 0.2 • 30 = 6 6 people own dogs only.
When you are done, help others around you Classwork Complete worksheet Page 243
Homework Worksheet E-46