Download
1 / 24
250 likes | 446 Views
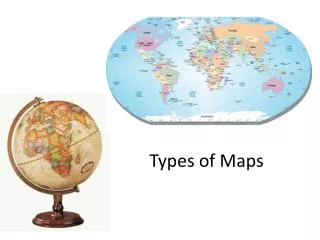
Cartography GEO381/550. Final Review December, 2 nd 2004. Choropleth map. How it works? When to use; when not to use? Phenomenon Data Limitation? Solution to this?. Sample question…. Which of the following data is the most suitable for choropleth mapping?

E N D
CartographyGEO381/550 Final Review December, 2nd 2004
Choropleth map • How it works? • When to use; when not to use? • Phenomenon • Data • Limitation? Solution to this?
Sample question… • Which of the following data is the most suitable for choropleth mapping? • Temperature records at stations • Number of hospital beds by county • Average SAT scores by school district • Total population by census tract • Explain why…
Proportional symbol map • How it works? • When to use; when not to use? • What is perceptual (apparent) scaling? • What is range grading?
Sample question… • Suppose we have two values, 6400 and 1600, that are to be symbolized and scaled by proportional circles. The ratio of radius of proportional circles that represent two values would be 2:1 when absolute scaling is adopted. What would happen to x in the ratio, say x:1 when perceptual scaling is adopted? • x will become larger than 2 • x will become smaller than 2
Sample question… • Suppose you have two maps in hand, whose maps have legends shown below. From the legends, discuss (1) data classification (2) the location of point symbols of respective map.
Dot density map • How it works? • When to use; when not to use? • Advantage & disadvantage?
Sample question… • Data not suitable for dot density map? • Number of farms • Total population • Property tax rate • Number of AIDS cases
Sample question… • Suppose you are asked to make a dot density map of corn acreage data which is enumerated by state. When mapped in ArcView, it didn’t turn out very well. What would you do in order to improve the quality of map, in particular locational accuracy?
Cartogram • How it works? • In which way, cartogram is fundamentally different from other mapping techniques? • Advantage & disadvantage?
Sample question… • In which of the following situations, would you consider cartogram to be an ideal choice? • Map readers are not familiar with areas • Data value is relatively proportional to the size of enumeration unit • The more value is concentrated in the small enumeration unit • Reference map
Sample question… • Which of the four geometric elements of enumeration units should be most strictly preserved? • Size • Contiguity • Shape • Orientation (relative location, order)
Role (function) of map • Map visualization (visual thinking) • Map communication (visual communication)
Sample question… • Suppose you are involved in two different projects: One is to map 2000 Census (say spatial distribution of racial group), and the other is to map the volcanic process of Mt. Helena. Discuss the roles of two maps. How would different roles of maps affect the cartographic process?
Visual hierarchy • What is? • What is the psychological phenomenon underlying visual hierarchy? • How to achieve visual hierarchy?
Color • Spectral reflectance curve? • Three psychological dimensions? • Munsell color solid? • Color primaries for display in computer screen? • Map design implications of simultaneous/successive contrast?
Color • How to promote efficient decoding of color? • Brewer color schemata • When you have population density data • When you have historical economic data (increase, decrease) • When you have bivariate historical economic data
Sample question… • Discuss how color is used to promote visual hierarchy in this map
Sample question… • Discuss color as visual variables in this map
Sample question… • How does hypsometric tint make the use of physical dimension of color (hue)? • Illustrate how color convention conflicts with symbolical connotation of color from this map.
Black Letter Sans serif Oldstyle Square serif Modern Modern Sans serif Oldstyle Black Letter Oldstyle Modern Sans serif Typography • Typeface classification Pay attention to serif and shading
Sample question…. • Suppose you have to label two distinct features, say retail superstores, and castles in the greater London area. Which of the following pairs do you find the most appropriate match respectively? A B C D
Discuss the use of type form (italics, spacing, case) in this map
Final • December 13th Monday • Here at 7:00-9:00 pm • Remember that extra point will be given to those who make a significant progress relative to midterm • Final project presentation • Dec 7 and 9 • Attendance will be taken