Download

1 / 52
530 likes | 683 Views
Statistical Issues at FDA. Greg Soon, Ph.D. Statistical Team Leader for Anti-viral Products FDA/CDER/OB/DBIII. 2006.3.2. 3:30-4:30 University of Maryland. Disclaimer. The opinions expressed are those of the author and do not necessarily reflect those of the FDA. Overview.

E N D
Statistical Issues at FDA Greg Soon, Ph.D. Statistical Team Leader for Anti-viral Products FDA/CDER/OB/DBIII 2006.3.2. 3:30-4:30 University of Maryland
Disclaimer The opinions expressed are those of the author and do not necessarily reflect those of the FDA.
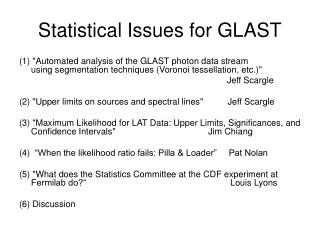
Overview • Statistical Issues at FDA • General discussion • Computer Intensive and Re-randomization Tests in Clinical Trials • From Intermediate endpoint to final endpoint: a conditional power approach for accelerated approval and interim analysis
Statistician in FDA • Review clinical trial protocols to ensure the design, conduct and analysis will meet regulatory requirements • Review New Drug Applications to determine if the trial outcome meet regulatory standard for marketing approval
Statistician in FDA • Submissions are reviewed by clinicians, statisticians, chemists, toxicologists, pharmacologists and microbiologists • CDER Has about 100 statisticians • Statisticians are organized in teams and divisions, each team serve one therapeutic area, like anti-viral drug products • Anti-viral deals with HIV, hepatitis, flu, cold, and herpes • Anti-viral team has 5 statistical reviewers • The team deal with about 160 protocol reviews and 20 new drug applications each year
Approval “Requirements” • Evidence equivalent to two clinical trials each meet a significance level of 0.05 • Controlling Type I error is the first order of business • Actual approval will be based on both efficacy and safety
Randomization • Central randomization vs. restricted by sites • Less predictable but may be less efficient • Block • Balance in small center vs. predictability • Dynamic allocation • Does forced balance on margins really beneficial?
Biases • Open-label biases • The knowledge of treatment will impact patient behavior, physician’s judgment, and outcome assessment • Trials design to show similarity of drugs can be manipulated • Poor conduct, poor data collection, poor assessment, and random manipulation can drive the results in favor of drug sponsor • Interim looks or adaptation can introduce biases • May affect future enrollment of patients • May affect the existing patients’ decision of continuing or terminating current trial
Interim Analysis and Adaptive Designs • Interim analysis: Multiple looks of the data before the trial is over. • Adaptive Design: Alter the trial design in the process based on accumulated information. For example, dropping one arm, increase sample size • Both pose challenge in controlling type I error. They may also pose challenge for the effect size estimation.
Statistical Issues with Endpoint • Surrogate endpoint: searching and validation • Robustness of endpoint vs. Sensitivity • Composite endpoints
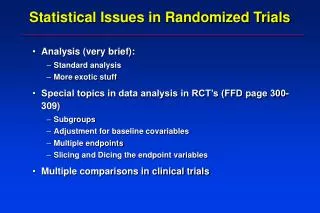
Multiple Comparisons • Multiple Endpoints • Subgroup analysis • Multiple analysis
Missing Data and Discontinuations • Almost always informative • MCAR or even MAR not hold • Missing can be imputed • Robustness to credible imputations • Discontinuations are outcomes, not missing data • need to be interpreted • Efficacy had they continued does not answer regulatory question
Example 1: Multiple comparison adjustment • A clinical trial containing three arms, new Drug X at a low dose, new Drug X at a higher dose, and placebo. The objective of the trial is to gain evidence for the approval of drug X. Do we need to adjust for multiple comparisons? • The sponsor proposes to test the high dose vs. placebo first. • If p-value<0.05 then compare low dose vs. placebo at significance level 0.05. • If p-value>0.05, stop.
Example 2: Multiple comparison adjustment • A clinical trial containing three arms, new Drug X, new Drug Y, and placebo. The objective of the trial is to gain evidence for the approval of drug X and Y. Do we need to adjust for multiple comparisons?
Example: Method for Stratification • A clinical trial containing two arms, new Drug X and placebo. The randomization are being stratified by clinical sites. The clinical sites ranges from very small to very large. The sponsor proposes to estimate and test the mean differences using the following statistic (minimum variance estimator):
Combination Therapy • A Full factorial design: P A B A+B • To approve A, A>P • To approve B, B>P • To approve A+B, A+B>A & A+B>B • Any multiple comparison issue?
2. COMPUTER INTENSIVE AND RE-RANDOMIZATION TESTS IN CLINICAL TRIALSJoint with Thomas Hammerstrom, Ph.D.
OBJECTIVE OF TALK Discuss role of randomization and deliberate balancing in experimental design. Compare standard and computer intensive tests to examine robustness of level and power of common tests with deliberately balanced assignments when assumed distribution of responses is not correct.
OUTLINE OF TALK • Testing with Deliberately Balanced Assignment • Common Mistakes in Views on Randomization and Balance • Robustness Studies on Inference in Deliberately Balanced Designs
DYNAMIC ASSIGNMENTS • Identify several relevant, discrete covariates, e.g., age, sex, CD4 count • Change randomization probabilities at each assignment to get each level of each covariate split nearly 50-50 between arms
DYNAMIC ASSIGNMENTS • Change randomization probabilities at each assignment to get each level of each covariate split nearly 50-50 between arms. Assign new subject randomly if all covariates are balanced assign deterministically or with unequal probabilities to move toward marginal balance if not currently balanced
ISSUES WITH DYNAMIC ASSIGNMENTS • Why bother with this elaborate procedure? • Are the levels of tests for treatment effect preserved when standard tests are used with dynamic (minimization) assignments? • Does the use of minimization increase power in the presence of both treatment and covariate effects?
Mistake 1. Purpose of Randomization is to Create Balance in Baseline Covariates Fact: Purpose of Randomization is to Guarantee Distributional Assumptions of Test Statistics and Estimators
Mistake 2. It is good practice in a randomized trial to test for equality between arms of a baseline covariate. Fact: All observed differences between arms in baseline covariates are known with certainty to be due to chance. There is no alternative hypothesis whose truth can be supported by such a test.
Mistake 3. If a test for equality between arms of a baseline covariate is significant, then one should worry. Fact: Such test statistics are not even good descriptive statistics since p-values depend on sample size, not just the magnitude of the difference.
Mistake 4. Observed Imbalances in Baseline Covariates cast Doubt on the Reality of Statistically Significant Findings in the Primary Analysis. Fact: The standard error of the primary statistic is large enough to insure that such imbalances create significant treatment effects no more frequently than the nominal level of the test.
Mistake 5. Type I Errors can be Reduced by Replacing the Primary Analysis with one Based on Stratifying on Baseline Covariates Observed Post Facto to be Unbalanced. Fact: The Operating Characteristics of Procedures Selected on the Basis of Observation of the Data are not generally Quantifiable.
If the Agency approved of Post Hoc Fixing of Type I Errors by Adding New Covariates to the Analysis (or by other Adjustments to ‘Fix Randomization Failures’), Then it should also Approve of Similar Post Hoc Fixing of Type II Errors when ‘Failure of Randomization’ Leads to Imbalance in Favor of the Control Arm.
Mistake 6. If the same Random Assignment Method gave more even Balance in Trial A than in Trial B, then one should place more trust in a Rejection of the Null Hypothesis from Trial A. Fact: Balance on Baseline Covariates Decreases the Variance of Test Statistics and Estimators. It Increases the Power of Tests when the Alternative Hypothesis is True. It has no Effect on Type I Error.
Mistake 7. Balance on Baseline Covariates Leads to Important Reductions in Variances. Fact: Even without Balance, the Variance of Tests and Estimators are of size O(1/N) where N = sample size. Balancing on p Baseline Covariates Decreases these variances by Subtracting a Term of size O(p/N2)
Typical model for Continuous Response: Yik = mi + g1x1ik + … + gpxpik + eik where eik ~ N(0, s2) mi = treatment effect, Xik = (x1ik,…,xpik) = vector of covariates g1 ,…, gp = unknown vector of covariate effects
s2 * Precision of Estimate of (m1-m0 ) = N/2 - Z’Z where N = number per arm, Z = V-1(X1. - X0.), V2 = matrix of cross-products of X/2N, and randomization distribution of (X1. - X0.) ~ N( 0, V2), of Z ~ N(0, Ip), of Z’Z ~ Chi-square(p) Precision with Balance = N/2, E(Precision without Balance) = N/2 - O(p)
III. ROBUSTNESS STUDIES ON INFERENCE IN DELIBERATELY BALANCED DESIGNS A. MODELS USED TO COMPARE METHODS
METHODS COMPARED 1. Dynamic Allocation analyzed by F-statistic from ANCOVA based on arm and covariates 2. Dynamic Allocation analyzed by re-randomization test, using difference in means 3. Randomized Pairs, analyzed by F-statistic from ANCOVA using arm and covariates
BASIC FORM OF SIMULATED DATA 1. Control & test arms, N subjects randomized 1:1 2. X1j, …, X7j = binary covariates for subject j 3. ej = unobserved error for subject j 4. Yj = observed response for subject j 5. I1j = 1 if subject j in arm 1, test arm 6. Yj = mj I1j + ej + d Sk=17Xkj
MODELS FOR ERRORS 1. ej ~ N( 0 , 1 ) Normal 2. ej ~ exp( N( 0 , 1 )) Lognormal 3. ej ~ N( 4j/N , 1 ) Trend 4. ej ~ .9 N( 0 , 1) + .1 N( 0, 25 ) Mixed 5. ej ~ N( 0 , 4j/N ) Hetero 6. ej ~ N( cos(2pj/N) , 1 ) Sine wave 7. ej ~ N( 0 , 1 ) if j<J ~ N(4, 1) if j>=J Step
MODELS FOR COVARIATES X1j, …, X7j are 1. independent with p1, …, p7 constant in j 2. correlated with p1, …, p7 constant 3. independent with p1, …, p7 monotone in j 4. independent with p1, …, p7 sinusoid in j Coefficient d = 1 or 0
MODELS FOR TREATMENT 1. Treatment effect mj = m, constant over j 2. Treatment effect mj = m * (4j/N), increasing over j
COMPARISONS 1. Select one of the models 2. Generate 200 sets of covariates and unobserved errors 3. For each set, construct I1j once by dynamic & once by randomized pairs 4. Compute the 200 p-values for different tests and assignment methods
SIMULATED DATA FOR COX REGRESSION 1. Control & test arms, N subjects randomized 1:1 2. X1j, …, X7j = binary covariates for subject j 3. YLj = observed response for subject j on arm L = 0 or 1 4. YLi /[ dL( 1+ Sk=17Xkj )] ~ FL, L = 0 or 1 5. FL = Exponential or Weibull 6. Censoring ~ Exp with scale large or small
RESULTS WITH COX REGRESSION 1. Assign subjects by dynamic allocation. 2. Estimate treatment effect by proportional hazards regression 3. Re-randomize and compute new ph reg estimates many times. 4. Compare parametric p-value with percentile of real estimate among all rerandomized treatment estimates
III. ROBUSTNESS STUDIES ON INFERENCE IN DELIBERATELY BALANCED DESIGNS B. RESULTS OF SIMULATIONS
SIMULATION RESULTS 1. In most cases considered, the gold standard but computer intensive re-randomization test gave the same power curve as the standard ANCOVA F-test for the dynamic allocation. Both level, when H0 was true, and power, otherwise, were the same.
SIMULATION RESULTS 2. In most cases considered, the ANCOVA F-test gave the same power curve whether the subjects were assigned by dynamic allocation or randomized pairs. Deliberate balance on baseline covariates gave no improvement in power.
SIMULATION RESULTS 3. There was one clear exception to the above findings. When covariates showed a trend with time of enrollment, the ANCOVA F-test for treatment gave incorrectly low power.
SIMULATION RESULTS 4. In most cases considered with time to event data with dynamic allocation, the re-randomization test gave the same results as the Cox regression.
SUMMARY 1. Modifying a Randomization Method to Achieve Deliberate Balance Serves Mainly Cosmetic Purposes & Should be Discouraged 2. Balance on Covariates Reduces Variance of Test Stats & Estimators but Only by Small Amounts Var( trt effect) = O(1/N) when balanced When unbalanced , Var is larger by a term = O(p/N2)