Download

1 / 21

E N D
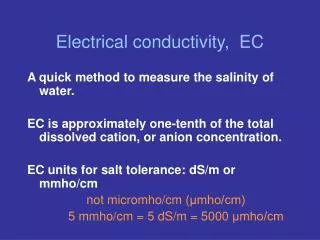
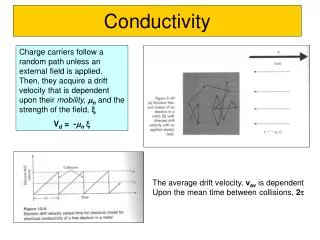
Introduction The electrical conductivity (EC) of soil-water mixtures indicates the amount of salts present in the soil. All soils contain some salts, which are essential for plant growth. However, excess salts will hinder plant growth by affecting the soil-water balance. Soils containing excess salts occur both naturally and as a result of soil use and management. Salt-affected soils are largely found in the western arid and semiarid areas of the country, where the annual rainfall is low, allowing salts to accumulate in the soil profile. The electrical conductivity measurement detects the amount of cations or anions (salts) in solution; the greater the amount of anions or cations, the greater the electrical conductivity reading. The ions generally associated with salinity are Ca2+, Mg2+, K+, Na+, H+ (cations), or NO3-, SO42-, Cl-, HCO3-, OH- (anions).
Interpretations In general, EC 1:1 values between 0 and 0.8 dS/m are acceptable for general crop growth. Site • specific interpretations for soil quality will depend on specific land use and crop tolerance -> Table 1 • shows the soil salinity class and general crop and microbial responses for each class.
Table 2 provides general salt tolerance ratings for selected crops. These ratings apply to soils • in which chloride (Cl-) is the predominant anion. The EC of soils containing gypsum will tolerate • 1 dS/m higher than those listed in this table (Tanji, 1990). Consult a local Soil Survey to determine • if gypsum is present in the soil of interest.
Table 1. Electrical conductivity measurement and salinity classes for a 1:1 soil:water suspension (Soil Survey Staff (1993), Janzen (1993), and Smith and Doran (1996)
Excess salts affect plant growth by (1) direct toxicities; e.g., boron; (2) disrupting the ionic • balance in the plant; (3) interfering with nutrient uptake; e.g., blossom-end rot of tomatoes due to • high salt interference with calcium uptake; and (4) reducing the availability of water by lowering • the osmotic potential (Fitter and Hay, 1987). Excess sodium (Na+), often expressed as exchangeable • sodium percentage (ESP), can deteriorate soil structure by dispersing soil clays.
Considerations • The electrical conductivity of a solution is affected by temperature. Generally the electrical • conductivity of a solution increases with temperature at a rate of approximately 1.9% per 1EC • increase (Rhoades, 1993). The conductivities in Table 5 are standardized at 25EC. Most EC meters • adjust for deviations from 25EC within a specific temperature range. Therefore, conductivity • measurements must be taken within this temperature range (Refer to instructions packaged with • the meter.) to avoid under- or overestimating the electrical conductivity.
Table 3. Temperature conversion factors for correcting conductivity data to standard temperature of 25oC(Dr Leow: Atomic Chuan Tse Biotechnology Section Chemical Process and Biotechnology Department Singapore Polytechnic, 1995)
Generally, the effects of soil moisture on the EC measurement will be negligible when soil • water content is at or below field capacity. If water content is above field capacity, adjustments • should be made to maintain a 1:1 ratio of soil to water. Another approach would be to air-dry the • soil if it is too wet.
When distilled water is not available, tap or rain water can be used. Measure the conductivity • of the water source, and subtract the water source EC value from the sample EC value. • The relationship between electrical conductivity and salt concentration is only approximate. • General relationships that have been established are (Rhoades, 1996): 1) Total cation (or anion) concentration: meq/L . 10 x EC (dS/m). 2) Total dissolved solids: mg/L . 640 x EC (dS/m). 3) Osmotic pressure: kPa (at 25 EC) . 0.36 x EC (dS/m).
Where NO3 is the predominant ion in the soil solution, a very useful relationship has been established between the EC (in 1:1 soil to water mixture) readings and soil nitrate (NO3) concentrations (Smith and Doran, 1996). EC (dS/m) x 140 . mg NO3-N/kg of soil This relationship assumes the complete extractability of NO3 in water and that NO3 is the major anion in the soil solution.
Conversions • 1 dS/m (decisiemens per meter) = 1 mmhos/cm (millimhos per centimeter) • 1 dS/m (decisiemens per meter) = 1000 FS/cm (microsiemens per centimeter) • 1000 FS/cm (microsiemens per centimeter) = mS/cm (millisiemens per centimeter)
Conductivity can be measured at any of the following units: (Dr . Leow: Atomic Chuan Tse Biotechnology Section Chemical Process and Biotechnology Department Singapore Polytechnic, 1995) • EC or electroconductivity: EC is expressed as either millimhos per centimeter (mMHo/cm), or as millisiemen per centimeter (mS/cm). Note that 1 mMho/cm is equal to 1 mS/cm. 2) cF or conductivity factor: In agricultural chemistry, electrical conductance often expressed as cF in order to avoid the use of the decimal point required in mMho or mS. Note that 1 mMho/cm = 1 mS/cm = 10 cF. 3) The relationship between the EC, eF, and total desolved solutes (TDS) is shown in Table. Note that 1 mS/cm is aproximately equal to 700 ppm of salt.
Table 4. Conversion Chart for EC, cF and TDS(Dr Leow: Atomic Chuan Tse Biotechnology Section Chemical Process and Biotechnology Department Singapore Polytechnic, 1995)
The total concentration of elements in a nutrient solution should be between 1000 ppm and 1500 ppm so that the osmotic pressure will facilitate the absorption prosses by the roots. This should correspond to total salt conductivity readings (EC readings) of about 1.5 to 2.0 mS/cm. However depending on the plant species, the preferred EC values for optimal plant growth may be lower or higher than 1.5 to 2.0 mS/cm. As general rule, nutrient salt level above 4.0 mS/cm may result in wilting, suppressed growth, and fruit cracking. In Table, showed the range of EC value favoured by a horticultural variety of plants. For example, cucumber prefers EC of 2.5 mS/cm after first harvest. Between 3 and 7 weeks after the first harvest, the optimal EC is 1.7 mS/cm.
Table 5. Optmal EC values for a variety of plants(Dr Leow: Atomic Chuan Tse Biotechnology Section Chemical Process and Biotechnology Department Singapore Polytechnic, 1995)
Table 5. Optmal EC values for a variety of plants (cont.)(Dr Leow: Atomic Chuan Tse Biotechnology Section Chemical Process and Biotechnology Department Singapore Polytechnic, 1995)