Download
1 / 24
610 likes | 1.19k Views
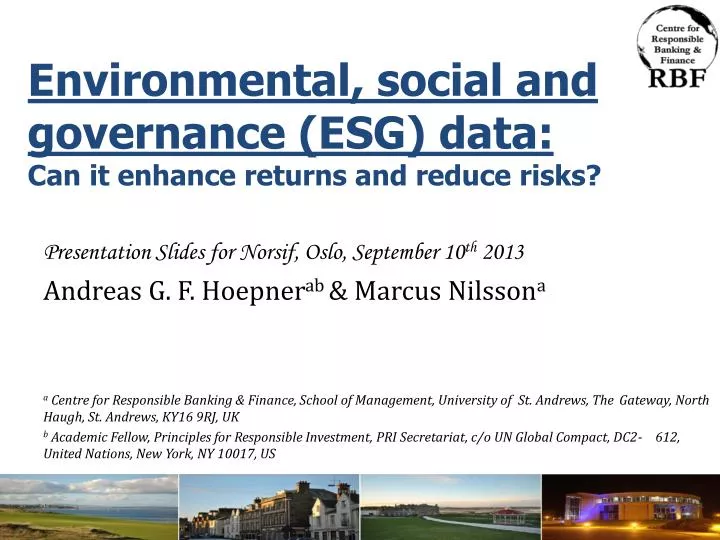
Environmental, social and governance (ESG) data: Can it enhance returns and reduce risks?. Presentation Slides for Norsif , Oslo, September 10 th 2013 Andreas G. F. Hoepner ab & Marcus Nilsson a

E N D
Environmental, social and governance (ESG) data: Can it enhance returns and reduce risks? Presentation Slides for Norsif, Oslo, September 10th 2013 Andreas G. F. Hoepnerab& Marcus Nilssona a Centre for Responsible Banking & Finance, School of Management, University of St. Andrews, The Gateway, North Haugh, St. Andrews, KY16 9RJ, UK b Academic Fellow, Principles for Responsible Investment, PRI Secretariat, c/o UN Global Compact, DC2- 612, United Nations, New York, NY 10017, US
Disclaimer • This document represents a confidential presentation to Norsif. It is intended for the eyes of members of Norsif only. This document does not represent any form of consulting or advice or other commercial activity. It is simply intended to aid the information exchange between Norsif, the UN PRI and the Centre for Responsible Banking & Finance at the University of St Andrews. The authors take no responsibility for any actions taken as a consequence of reading or otherwise receiving information from this document.
Historical emergence of ESG criteria • Prior To WW2 • ESG mattered little in the business environment • Post-war period • A shortage of workers, Power to unions, Employee rights • Consumer rights and civil rights • Opposition to the Vietnam War • Early 1970s • From the business sphere into the investment sphere • Universities endowment investment policies • The Pax World Fund August 1971 • Late 1970s and 1980s • Environmental concerns • Scandals: Bhopal, Chernobyl, Exxon Valdez. • Rating firms: EIRiS in the U.K. and Kinder, Lydenberg & Domini (KLD) in the U.S. . • Systematic integration of social and environmental criteria in active or passive investment processes. • The Domini 400 Social Index, 1990 • 1990s • Corporate governance • Scandals: Enron and Tyco, leading to the passage of the Sarbanes- Oxley Act in 2002 (Biehl et al., 2012), (Malkiel, 1973),( Malkiel and Quandt, 1971),( Simon et al., 1972), (Sparkes, 2002), (Sparkes and Cowton, 2004), (Barber, 2007, (Bebchuk and Weisbach, 2010), (Grandmont et al., 2004), (Grant, 2005), (La Porta et al., 2000), (Letza et al., 2004), (Nesbitt, 1994), (Shleifer and Vishny, 1997)
Ethical and ESG investment • A pure exclusionary strategy is probably not the best idea • Hoepner & Nilsson (2011) • Methodology: A similar approach to that of Kotter & Lel 2011 was used to record disclosed transactions of the six Swedish national pension funds. News databases were searched for investment news and categorised as either “invest”, “divest”, “engagement”, or “blacklisted”. • Only equity • Created a portfolio from companies blacklisted by Swedish AP7 • Different combinations of these categories were then used to construct equal and value weighted portfolios which were then evaluated using the Carhart 4 factor model. • controlling for market benchmark, size effects, value vs. growth effects, and momentum vs. contrarian effects • January 2001 to June 2011
Ethical and ESG investment • A pure exclusionary strategy is probably not the best idea (2) • Hoepner & Nilsson (2011) • Limitations: • Only disclosed transactions (news) • Assumptions made only on publicly available news recordings • Only Equity • No size of investment • Does not take into account increase/decrease in stake • This was done intentionally as we applied an investment signal approach to evaluate the investment strategies of the funds • In some cases, low number of observations
Ethical and ESG investment • A pure exclusionary strategy is probably not the best idea (3) • Hoepner & Nilsson (2011) Portfolios of disclosed transactions Blacklist Equally and value weighted portfolios respectively. AP1, AP2, AP3, AP4 = Invest+Engagement – Divest , AP6= Invest-Divest, AP7= Blacklist Red, orange and yellow indicate the 1%, 5% and 10% significance level, respectively. Grey bars represent statistically insignifiicant estimations
Can ESG criteria enhance investment returns?Discussing of opponents’ views (Hoepner, 2013) • Focus on Hong and Kacperczyk (2009), • ‘sin stocks,’ outperform market benchmarks in a sample ending 2006. • This criticism of ESG investment requires two qualifications. • First, it is relevant for a few early ESG investment strategies. It is irrelevant, however, for the many modern ESG investment strategies. • Second, Hong and Kacperczyk did not present any value-weighted sin stock portfolios, despite their market benchmarks being value-weighted. • They exclusively analysed equal- weighted portfolios, which are biased through over- weighting small-cap stocks and underweighting large- cap stocks. As commonly known, small-cap stocks outperform large-cap stocks over large sample periods. • Lobe and Walkshäusl (2011): value-weighted portfolios do not significantly outperform their benchmarks.
Can ESG criteria enhance investment returns?Discussing of opponents’ views (Hoepner, 2013) • Opponents of active management – with or without ESG data – point to academic studies showing that the average mutual fund or hedge fund fails to significantly outperform the benchmark (Kosowski et al., 2007, Kosowski et al., 2006). • When one considers, however, that most financial market trades involve a fund manager on each side of the deal, it becomes clear that fund management has similarities to a zero sum game relative to the market benchmark, in which the better outperforms the worse and the average performs very close to the benchmark. • In this sense, studies finding that the average ESG integrating investment fund does neither outperform nor underperform its conventional peers simply do not address the relevant question, • Ask: ‘How well does the average ESG investment process perform?’ • Should ask: ‘Can ESG criteria enhance returns on investment processes if implemented sophisticatedly?’ • In this sense, the fact that academic research repeatedly finds ESG investment performance on par with conventional peers does not mean that sophisticated ESG asset managers cannot outperform (Bauer et al., 2005, Bello, 2005, Hoepner and McMillan, 2009, Kreander et al., 2005, Renneboog et al., 2008, Schröder, 2007). • (Gil-Bazo et al., 2010) - Technical sophistication is crucial for ESG investment processes.
Can ESG criteria enhance investment returns?Discussing of opponents’ views (Hoepner, 2013) • Technical sophistication is crucial for investment processes more generally • Grossmann and Stiglitz’s (1980) ‘Paradox of Market Efficiency.’ • When sensible investment approaches are unpopular among investment managers, opportunities to identify market inefficiencies are likely to arise and result in increasing popularity. • Once, however, an ever increasing number of active asset managers follow a certain investment approach (i.e., use the same information sets to analyse the same asset classes), their joint activity reduces the opportunities to find market inefficiencies based on this approach and only the most sophisticated managers will still be able to profit. • A commercially relevant information set is more interesting for asset managers if it is currently considered by less competitors. • ESG datasets and professional finance degrees
Research Insights:Can ESG integration enhance investment returns?
Overview on ESG Alpha findings • ESG integration strategies can lead to sizable abnormal returns (Alphas): • Corporate Governance (Bebchuk et al., 2009, Gompers et al., 2003) • ESG Engagement (Becht et al. 2009) • Eco-efficiency (Derwall et al., 2005) • Employee Relations (Statman and Glushkov, 2009; Edmans, 2011) • Community Relations (Kempf and Osthoff, 2007, Statman and Glushkov, 2009) • Green Real Estate (Eichholtz, Kok and Quigley, 2010) • Best in class strategies (Kempf and Osthoff, 2007; Statman and Glushkov, 2009) • Successful ESG investment requires specific skills (Gil-Bazo et al., 2009) • Financial institutions with more ESG appeal are found to • Realise better competitive outcome in mortgage and deposit markets (Callado-Muñoz & Utrero-Gonzalez, 2011) • Have more loyal clients (Bollen, 2007).
Integration across ESG criteria (Kempf and Osthoff, 2007): The authors analysed the performance of a long-short investment strategy backing the top 5% and shorting the bottom 5% stocks in an ESG criteria over the period 1991 to 2003 for the US market. Light green, dark green and yellow indicate the 1%, 5% and 10% significance level, respectively. Grey bars represent statistically insignifiicant estimations
ESG integration in 10 GICS industries (Hoepner, Yu & Ferguson, 2010): We analysed the performance of investing in the Global 100 most (likely) sustainable companies in the year before (left bar) and after (right bar) the companies from each Global Industry Classification Standard (GICS) industry received the annual award at the World Economic Forum from 2005-2008. Light green, dark green and yellow indicate the 1%, 5% and 10% significance level, respectively. Grey bars represent statistically insignifiicant estimations
ESG integration in 10 GICS industries (Hoepner, Yu & Ferguson, 2010): We analysed the performance of investing in the Global 100 most (likely) sustainable companies in the year before and after the companies from each Global Industry Classification Standard (GICS) industry received the annual award at the World Economic Forum. ***, ** and * indicate the 1%, 5% and 10% significance level, respectively
Successful ESG investment requires specific skills (Gil-Bazo, et al, 2009): • Found that US SRI funds had better before and after-fee performance than conventional funds with similar characteristics. • The difference however, were driven exclusively by SRI funds run by management companies specialized in SRI. • While these funds significantly outperform similar conventional funds, funds run by companies not specialized in SRI underperform their matched conventional funds. • Found no significant differences in fees between SRI and conventional funds except in one case: SRI funds are cheaper than conventional funds run by the same management company. Light green, dark green and yellow indicate the 1%, 5% and 10% significance level, respectively. Grey bars represent statistically insignifiicant estimations
Research Insights:ESG integration can reduce risk at the firm and portfolio level
Overview on ESG Risk Reduction findings • Companies with high ESG scores are found to have less company specific risk (Bouslah et al., 2012; Boutin-Dufresneand Savaria, 2004; Lee and Faff, 2009; Bauer, Derwall and Hann, 2009; Oikonomou et al., 2012). • Corporations with better ESG ratings are found to have lower cost of debt and higher credit ratings (Bauer et al., 2009; Bauer and Hann, 2011; Oikonomou et al. 2011). • ESG criteria are found to provide an insurance like protection for firms in legitimacy crisis (Godfrey, Merrill and Hansen, 2009).
ESG, volatility/uncertainty and downside risk • Hoepner, Rezec and Siegl (2011) studied the risk implications of integrating environmental responsibility criteria in an annnually updated FTSE All World Developed universe from Jan 2005 to October 2010 (24 countries, about 1,800 firms per annum) • ESG Sample: Annual (5 step) EIRiS ratings for (i) Environmental Policy, (ii) Environmental Management, (iii) Environmental Impact, (iv) Environmental Reporting and (v) Overall Environment [Average of criteria (i)-(iv)]
The volatility/uncertainty of good ESG portfolios is not bad … Standard Deviation Average number of firms for each portfolio: 610 181 239 345 146 521 62 283 240 414 166 334 49 111 654 180 273 242 75 479 99 205 570 99 Environmental Performance Environmental Reporting Average Environmental Rating Environmental Management Environmental Policy
But the downside risk of exceptionally ESG rated portfolios is stunning …… despite usually fewer constituents! Minimum Return Average number of firms for each portfolio: 610 181 239 345 146 479 99 205 570 99 521 62 283 240 414 654 180 273 242 75 166 334 49 111 Environmental Performance Environmental Reporting Average Environmental Rating Environmental Management Environmental Policy
References • BAUER, R., KOEDIJK, K. G. & OTTEN, R. 2005. Inter- national Evidence on ethical mutual fund performance and investment style. Journal of Banking & Finance, 29, 1751-1767. • BAUER, R., DERWALL, J. & HANN, D. 2009. Employee Relations and Credit Risk. Available: http://papers.ssrn. com/sol3/papers.cfm?abstract_id=1483112 [Accessed 2010. February, 28]. • BEBCHUK, L., COHEN, A. & FERRELL, A. 2009. What Matters in Corporate Governance? Review of Financial Studies, 22, 783-827. • BECHT, M., FRANKS, J., MAYER, C. & ROSSI, S. 2009. Returns to Shareholder Activism: Evidence from a Clinical Study of the Hermes UK Focus Fund. Review of Financial Studies, 23, 3093-3129. • BELLO, Z. Y. 2005. Socially responsible investing and portfolio diversification. Journal of Financial Research, 28, 41-57. • BOLLEN, N. P. B. 2007. Mutual Fund Attributes and Investor Behaviour. Journal of Financial and Quantitative Analysis, 42, 683-708. • BOUTIN-DUFRESNE, F. & SAVARIA, P. 2004. Corporate Social Responsibility and Financial Risk. Journal of Investing, 13, 57-66. • CALLADO-MUÑOZ, F. J. & UTRERO-GONZALEZ, N. 2010. Does It Pay to Be Socially Responsible? Evidence from Spain's Retail Banking Sector. Forthcoming in European Financial Management. • EDMANS, A. 2011. Does the Stock Market Fully Value Intangibles? Employee Satisfaction and Equity Prices. Journal of Financial Economics, 101, 621-640. • EICHHOLTZ, P., KOK, N. & QUIGLEY, J. M. 2010. Doing Well by Doing Good? Green Office Buildings. American Economic Review, 100, 2494-2511. • GIL-BAZO, J., RUIZ-VERDÚ, P. & SANTOS, A. A. P. 2010. The Performance of Socially Responsible Mutual Funds: The Role of Fees and Management Companies. Journal of Business Ethics [Online], 94, 243-263. Avail- able: http://papers.ssrn.com/sol3/papers.cfm?abstract_ id=1307043 [Accessed 2009, June, 1]. • GODFREY, P. C., MERRILL, C. B. & HANSEN, J. M. 2009. The Relationship between corporate social responsibility and shareholder value: an empirical test of the risk management hypothesis. Strategic Management Journal, 30, 425-445. • GOMPERS, P., ISHII, J. L. & METRICK, A. 2003. Corporate Governance and Equity Prices. Quarterly Journal of Economics, 118, 107-156. • GROSSMANN, S. J. & STIGLITZ, J. E. 1980. On the impossibility of informational efficient markets. American Economic Review, 70, 393-408. • HOEPNER, A. G. F. & MCMILLAN, D. G. 2009. Research on ‘Responsible Investment’: An Influential Literature Analysis comprising a rating, characterisation, categorisation & investigation. Available: http://papers.ssrn. com/sol3/papers.cfm?abstract_id=1454793 [Accessed 2009, September, 6]. • HOEPNER, A. G. F., YU, P.-S. & FERGUSON, J. 2010. Corporate Social Responsibility across Industries: When can who do well by doing good?, Working Paper, School of Management, University of St. Andrews. Available: http://papers.ssrn.com/sol3/papers.cfm?abstract_id=1284703 [Accessed 2010, March, 16]. • HOEPNER, A. G. F., REZEC, M. & SIEGL, S. 2011. Does pension funds' fiduciary duty prohibit the integration of any ESG criteria in investment processes? A realistic prudent investment test. Working Paper, School of Management, University of St. Andrews. Available: http://papers.ssrn.com/sol3/papers.cfm?abstract_id=1930189 [Accessed 2011, November 25]. • HOEPNER, A. G. F., NILSSON, M. 2011, Financial performance and social responsibility of pension funds: The case of Sweden,Working Paper, School of Management, University of St. Andrews. • HONG, H. & KACPERCZYK, M. 2009. The price of sin: The effects of social norms on markets. Journal of Financial Economics, 93, 15-36. • KEMPF, A. & OSTHOFF, P. 2007. The Effect of Socially Responsible Investing on Portfolio Performance. European Financial Management, 13, 908-922. • KOSOWSKI, R., TIMMERMANN, A., WERMERS, R. & WHITE, H. 2006. Can Mutual Fund “Stars” Really Pick Stocks: New Evidence From a Bootstrap Analysis. Jour- nal of Finance, 61, 2551-2595. • KOSOWSKI, R., NAIK, N. Y. & TEO, M. 2007. Do hedge funds deliver alpha? A Bayesian and bootstrap analysis. Journal of Financial Economics, 84, 229-264. • KREANDER, N., GRAY, R. H., POWER, D. M. & SIN- CLAIR, C. D. 2005. Evaluating the Performance of Ethical and Non-ethical Funds: A Matched Pair Analysis. Journal of Business Finance & Accounting, 32, 1465-1493. • LEE, D. D. & FAFF, R. W. 2009. Corporate Sustainability Performance and Idiosyncratic Risk: A Global Perspective. The Financial Review, 44, 213-237. • LOBE, S. & WALKSHÄUSL, C. 2011. Vice vs. Virtue Investing Around the World. Available: http://papers. ssrn.com/sol3/papers.cfm?abstract_id=1089827 [Accessed 2009, May, 22]. • RENNEBOOG, L., TER HORST, J. & ZHANG, C. 2008. Socially Responsible Investments: Institutional Aspects, Performance, and Investor Behaviour. Journal of Banking & Finance, 32, 1723-1742. • SCHRÖDER, M. 2007. Is there a Difference? The Performance Characteristics of SRI Equity Indices. Journal of Business Finance & Accounting, 34, 331-348. • STATMAN, M. & GLUSHKOV, D. 2009. The wages of social responsibility. Financial Analysts Journal, 65, 33-46.