Download

1 / 43
430 likes | 520 Views
Climate Change perspectives from the North. Sea Ice. 1979. Summer Sea Ice. NASA. 4. 1979 - 1999 average. Summer Sea Ice. NASA. 5. 2004. Summer Sea Ice. NASA. 6. 2005. Summer Sea Ice. NASA. 7. 2006. Summer Sea Ice. NASA. 8. 2007. Summer Sea Ice. NASA. 9. 2008.

E N D
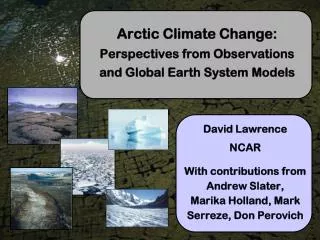
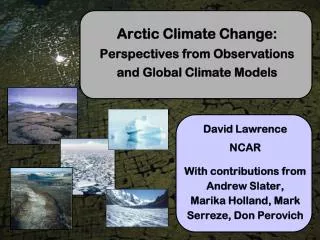
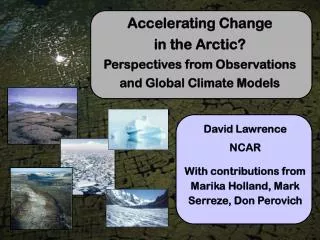
Climate Change perspectives from the North
1979 Summer Sea Ice NASA 4
1979 - 1999 average Summer Sea Ice NASA 5
2004 Summer Sea Ice NASA 6
2005 Summer Sea Ice NASA 7
2006 Summer Sea Ice NASA 8
2007 Summer Sea Ice NASA 9
2008 Summer Sea Ice NASA 10
2009 Summer Sea Ice NASA 11
Winter Sea Ice Trends
take home messages Arctic sea ice - is melting - is melting fast - will impact the globe
Global Mean Temperature Temperature (°C) data source: NASA Goddard Institute
Global Mean Temperature Temperature (°C) 130 year trend +0.06 °C / decade data source: NASA Goddard Institute
Global Mean Temperature Temperature (°C) 50 year trend +0.15 °C / decade data source: NASA Goddard Institute
Global Mean Temperature Temperature (°C) 20 year trend +0.20 °C / decade data source: NASA Goddard Institute
New Energy Storage Atmosphere 3% Soil 4% Ice 8% Ocean 85%
take home messages Climate change - is here - is significant - more change is expected
What is the cause of climate change?
take home messages Climate change • is caused by the burning of fossil fuels • we are all responsible • we need to shift the energy economy
World Oil Prices source: US Energy Information Administration $ per barrel
World Oil Prices source: US Energy Information Administration $ per barrel
World Oil Prices source: US Energy Information Administration $ per barrel
Rough Energy Statistics Oil Coal Natural Gas Nuclear Renewables Global Mix 35% 30% 20% 5% 10% Cost/ kWh $.05 $.04 $.04 $.10 - .20 $.04 - .06 $.08 $.30 +$50CO2 Tax $.06 ($.07) $.06 $.05 $.10 - .20 $.04 - .06 $.08 $.30 Oil (Bitumen) Coal Natural Gas Nuclear Hydro Wind Solar (PV)
sector end use gas Global GHG emissions by sector source: World Resource Institute CAIT source: from 2000 including land use (CO2eq)
Canadian Emissions source: Stats Canada
take home messages Energy economy • cost of fossil fuels is rising • emissions are rising • we need to shift the energy economy