Download
1 / 9
90 likes | 265 Views
IRAC/MIPS view of the ISM: PAHs dominate in IRAC. Li & Draine (2001) dust emissivity model; only very strong (> 10 3 x avg.) radiation fields contribute to thermal emission at 8 m.

E N D
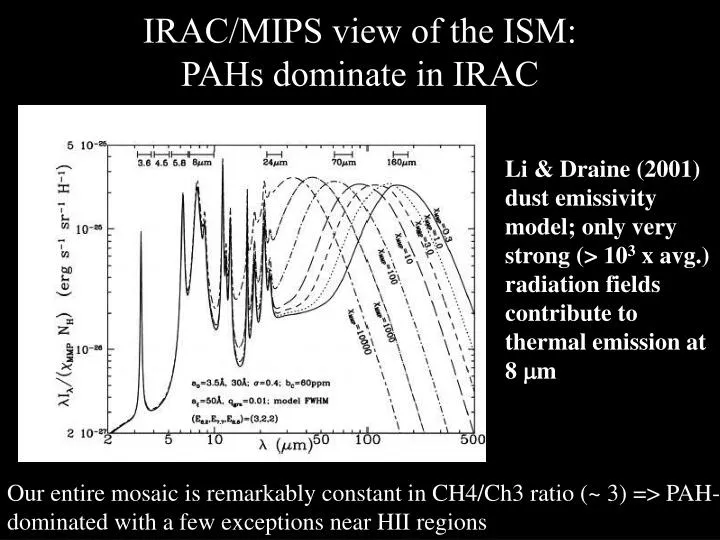
IRAC/MIPS view of the ISM: PAHs dominate in IRAC Li & Draine (2001) dust emissivity model; only very strong (> 103 x avg.) radiation fields contribute to thermal emission at 8 m Our entire mosaic is remarkably constant in CH4/Ch3 ratio (~ 3) => PAH-dominated with a few exceptions near HII regions
Massive stars are rare, but once a single massive star forms, the game changes. • L ~ 105 – 106 L • Intense EUV, FUV radiation • Powerful winds • Supernova This energy input quickly reshapes the environment, dominating all that goes on there, perhaps including low-mass star formation.
Star formation near massive stars is NOT Taurus-Auriga writ large!!!! Disks in Orion Disks in Taurus-Auriga
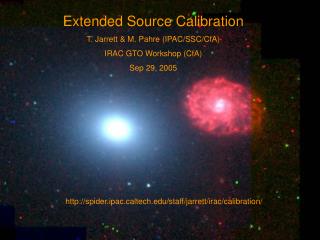
Structure of H II region carved by radiation from massive stars. Dark – Molecular gas Massive stars Dense gas compressed in advance of the ionization front Blue – Hot (~104 K), tenuous (~30 cm-3), ionized cavity. The H II region interior. Red – Ionization front pushing into and evaporating dense gas
Direct counts E.g., Lada & Lada, 2003, Ann. Rev. Astron. Astrophys, 41, 57 Complete survey of embedded clusters out to 2 kpc: - 70 – 90% of stars form in dense clusters - Of these, 75% currently near massive stars • Isolated star formation, such as that seen in Taurus-Auriga is atypical. The majority of low-mass, Sun-like stars form instead in rich clusters and in proximity to massive stars. • Short-Lived Radionuclides (SLRs) require that the Sun formed near a massive star. • Solar mass stars form in dense gas, then are soon uncovered by the ionization front, leaving young disks sitting in a hot, tenuous region near one or more massive stars. • Triggered Star Formation may be the standard mode of star formation, even in turbulent environments.
< 2 Msun 2 < Msun < 5 > 5 Msun Embedded YSOs - 4 kpc* *Assuming GLIMPSE sensitivities
Limitations of Color-Color Analysis • You need to detect the source in all four IRAC bands • Does not work well in crowded regions • There is significant ambiguity in interpreting the results • Does not discriminate different masses well • Although the effects of extinction are much smaller at these wavelengths, there are still degeneracies typical for stars at the GC • Solution: Fit ALL the SEDs
Tests on M16 data Embedded Disk Embedded or disk
M16: SED Fitter at Work (Whitney et al. 2003a,b,2004; Indebetouw et al. 2006; Robitaille et al. 2006) Stage I: Yellow Stage II: Green Stage III: Blue • A by-product of the fitting program is a best-fit extinction to each source • Includes the MS and Giant stars