Download
1 / 15
190 likes | 497 Views
Experimental and numerical investigations of 3D airfoil characteristics on a MW wind turbine. Niels Troldborg, Christian Bak, Niels N. Sørensen, Frederik Zahle, Helge Aa. Madsen, Srinivas Guntur, Pierre-Elouan Réthoré Wind Energy Department, DTU Wind Energy, DK-4000 Roskilde, Denmark.

E N D
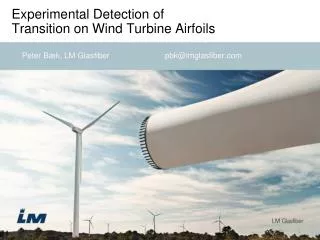
Experimental and numerical investigations of 3D airfoil characteristics on a MW wind turbine Niels Troldborg, Christian Bak, Niels N. Sørensen, Frederik Zahle, Helge Aa. Madsen, Srinivas Guntur, Pierre-Elouan Réthoré Wind Energy Department, DTU Wind Energy, DK-4000 Roskilde, Denmark
Background • Aeroelastic models typically use airfoil data (CL, CD) to predict aerodynamic forces
Background • Airfoil data commonly obtained from wind tunnel measurements in 2D steady flow Test section Inflow
Background • However, airfoil characteristics on a wind turbine can be quite different from wind tunnel measurements: • CL(α) varies with spanwise position • 3D effects are important! 3D airfoil charcteristics from the NREL/NASA Ames test. (From: Bak et al. Three-Dimensional Corrections of Airfoil Characteristics Based on Pressure distributions. EWEC 2006.)
Objectives • Study 3D aerofoil characteristics on a modern MW wind turbine vs. 2D aerofoil characteristics using • Wind tunnel tests • Full scale field experiment • 2D airfoil computations (CFD) • 3D rotor computations (CFD) • Evaluate quality of measurements and computations for studying 3D effects • Validate measurements and CFD • Verify that the datasets are suitable for future development/improvements of 3D airfoil correction models.
Experimental approach: The DANAERO MW project The Tjæreborg field experiment on the 2.3 MW NM80 turbine: • Four blade sections with 64 pressure taps: • Section 1: r/R=33%, NACA63-433 • Section 2: r/R=48%, NACA63-424 • Section 3: r/R=75%, NACA63-421 • Section 4: r/R=93%, NACA63-418 • Five-hole Pitot tubes at r/R=36%, 51%, 78% and 90%, respectively • High frequency measurements of wind speed and direction from nearby met mast Wind tunnel tests in the LM Wind Power tunnel: • Measurements on four aerofoils with the same shape as the instrumented sections on the LM38.8 blade of the NM80 turbine, i.e. sections 1, 2, 3 and 4.
Computational approach: EllipSys2D/3D 3D rotor computations on the NM80 turbine • 256x128x128 grid points on blade • Total mesh 432x32^3 • k-ω SST turbulence model • Correlation based transition model • Steady uniform inflow • 21 computations with varying wind speed and pitch angle 2D airfoil computations blade sections 1, 2, 3 and 4 of the NM80 turbine • 256x128 grid points • k-ω SST turbulence model • Correlation based transition model • Steady uniform inflow
Wind tunnel measurements vs 2D airfoil CFD Section 1 (NACA63-433) Section 2 (NACA63-424) Section 3 (NACA63-421) Section 4 (NACA63-418)
Wall effects in a wind tunnel Differences between measurements and CFD may be due to wall effects which are significant for thick aifoils FFA airfoil 30% thickness at AoA = 3°
Wall effects in a wind tunnel Differences between measurements and CFD may be due to wall effects which are significant for thick aifoils and airfoils at high AOA FFA airfoil 30% thickness at AoA = 3° NACA63-418 at AoA = 15°
Measurements on NM80 turbine vs 3D rotor CFD Section 1 NACA63-433 r/R=33% Section 2 NACA63-424 r/R=48% Section 3 NACA63-421 r/R=75% Section 4 NACA63-418 r/R=93% Comparison of Cp distributions at V∞=6.1 and RPM=12.1
Determining the angle of attack from 3D CFD • Azimuthal averaging technique (AAT) • Extract velocities in annular rings up and downstream of the rotor. • Compute azimuthal average for each ring • Interpolate average velocities from up and downstream to the rotor plane.
Determining the angle of attack from measurements • Extract 1-minute averages of measured distributions • Bin average on flow angle measured by Pitot tube at r/R=0.78, i.e. establish • From the rotor computations determine the AoA for each blade section using the AAT and establish • Estimate the measured AoA by minimizing • where n=64 is the number of pressure taps around the airfoil.
Comparison of 2D and 3D airfoil characteristics Section 1 (NACA63-433) Section 2 (NACA63-424) Section 3 (NACA63-421) Section 4 (NACA63-418)
Conclusions • Unique dataset for studying 3D airfoil characteristics in comparison with 2D characteristics on a modern MW wind turbine is established. • Suitable as a basis for future development/improvements of 3D correction models • 3D effects known from smaller turbines are documented • Increased in-board lift at high AOA • Decreased lift slope at in-board/out-board sections • Comparison between measured and computed airfoil characteristics on the NM80 rotor generally reveals good agreement • Large differences between 2D airfoil CFD and wind tunnel measurements for thick airfoils and for airfoils at high AOA. • Likely to be due to wall effects in the wind tunnel