Download
1 / 37
370 likes | 498 Views
Stay informed about the current El Niño conditions in the equatorial Pacific Ocean. Learn about SST anomalies, oceanic heat content, and atmospheric circulation patterns. Get insights for the upcoming season.

E N D
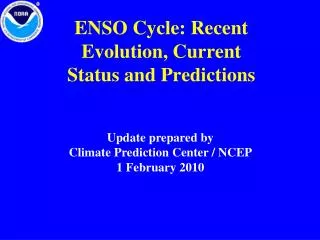
ENSO Cycle: Recent Evolution, Current Status and Predictions Update prepared by Climate Prediction Center / NCEP 1 February 2010
Outline • Overview • Recent Evolution and Current Conditions • Oceanic Niño Index (ONI) – “Revised December 2008” • Pacific SST Outlook • U.S. Seasonal Precipitation and • Temperature Outlooks • Summary • El Niño Composites
Summary • El Niño is present across the equatorial Pacific Ocean. • Sea surface temperatures (SST) are 1.0ºC- 2.5ºC above-average across much of the central and east-central equatorial Pacific. • Based on current observations and dynamical model forecasts, El Niño is expected to continue at least into the Northern Hemisphere spring 2010.
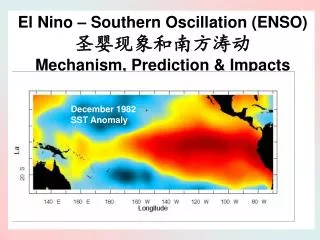
Recent Evolution of Equatorial Pacific SST Departures (oC) Since the beginning of June 2009, SST anomalies have been at least +0.5°C across most of the equatorial Pacific. During November 2009, positive SST anomalies remained nearly unchanged. During December 2009, positive SST anomalies increased across much of the equatorial Pacific. During January 2010, positive SST anomalies decreased across the east-central and eastern Pacific. Time Longitude
Niño Region SST Departures (oC) Recent Evolution The latest weekly SST departures are: Niño 4 1.3ºC Niño 3.4 1.2ºC Niño 3 0.7ºC Niño 1+2 0.4ºC
SST Departures (oC) in the Tropical Pacific During the Last 4 Weeks • During the last 4-weeks, equatorial SSTs were more than 2.0°C above average between 170°W and 150°W.
Global SST Departures (oC) During the last four weeks, equatorial SSTs were above-average across the Pacific, Indian, and Atlantic Oceans.
Weekly SST Departures (oC) for the Last Four Weeks • During the last four weeks, positive SST anomalies have weakened across the eastern half of the equatorial Pacific Ocean. • During the last 30 days, equatorial SST anomalies have decreased across the east-central and eastern Pacific.
Upper-Ocean Conditions in the Eq. Pacific • The basin-wide equatorial upper ocean (0-300 m) heat content is greatest prior to and during the early stages of a Pacific warm (El Niño) episode (compare top 2 panels) and least prior to and during the early stages of a cold (La Niña) episode. • The slope of the oceanic thermocline is least (greatest) during warm (cold) episodes. • Recent values of the upper-ocean heat anomalies (positive) and the thermocline slope index (negative) reflect El Niño. Cold Episodes Warm Episodes The monthly thermocline slope index represents the difference in anomalous depth of the 20ºC isotherm between the western Pacific (160ºE-150ºW) and the eastern Pacific (90º-140ºW).
Central & Eastern Pacific Upper-Ocean (0-300 m) Weekly Heat Content Anomalies Since April 2009, the upper-ocean heat content has been above average across the eastern half of the equatorial Pacific Ocean. Sharp increases in heat content during June and October coincide with the development and subsequent strengthening of El Niño, respectively.
Sub-Surface Temperature Departures (oC) in the Equatorial Pacific • In late December 2009, positive subsurface temperature anomalies increased in the central equatorial Pacific in association with the downwelling phase of an oceanic Kelvin wave. • Since mid January 2010, below-average subsurface temperatures have strengthened near the Date Line at depth (100-250m). • The most recent period (below) indicates a broad area of above-average subsurface temperatures across the eastern half of the equatorial Pacific Ocean. Time Most recent pentad analysis Longitude
Tropical OLR and Wind AnomaliesDuring the Last 30 Days Negative OLR anomalies (enhanced convection and precipitation, blue shading) were located over much of the region extending from the eastern Maritime Continent to the central equatorial Pacific Ocean. Positive OLR anomalies (suppressed convection and precipitation, red shading) were located over western Indonesia. Small low-level (850-hPa) easterly anomalies were observed across the central equatorial Pacific. Upper-level (200-hPa) easterly anomalies were observed across the equatorial Pacific. An anticyclonic couplet was evident in the subtropics of both hemispheres, which is consistent with El Niño. A A
Atmospheric Circulation over the North Pacific & North America During the Last 60 Days 200-hPa Wind 500-hPa Height & Anoms. 925-hPa Temp. Anoms. (oC) From December to early January, strong mid-latitude westerlies (East Asian and Atlantic jets) were accompanied by troughs over the North Pacific and North America. The troughs contributed to below-average temperatures across portions of the U.S. and Canada. At higher latitudes, strong ridging led to above-average temperatures across Alaska and northern Canada. Since mid January, the East Asian jet has extended farther east and a trough has strengthened over the eastern Pacific. Over much of N. America, strong ridging has contributed to above-average temperatures across Canada and the contiguous U.S. This recent pattern is typical of El Niño.
U.S. Temperature and Precipitation Departures During the Last 30 and 90 Days Last 30 Days 30-day (ending 30 Jan 2010) temperature departures (degree C) 30-day (ending 31 Jan 2010) % of average precipitation Last 90 Days 90-day (ending 31 Jan 2010) % of average precipitation 90-day (ending 30 Jan 2010) temperature departures (degree C)
Intraseasonal Variability • Intraseasonal variability in the atmosphere (wind and pressure), which is often related to the Madden-Julian Oscillation (MJO), can significantly impact surface and subsurface conditions across the Pacific Ocean. • Related to this activity • significant weakening of the low-level easterly winds usually initiates an eastward-propagating oceanic Kelvin wave. • Several Kelvin waves have occurred during the last year (see next slide).
Weekly Heat Content Evolutionin the Equatorial Pacific • In April 2009, the combined effects of an oceanic Kelvin wave and weaker-than-average easterly trade winds contributed to an increase in the upper-ocean heat content anomalies across the Pacific Ocean. • Since April 2009, heat content anomalies have remained above-average, but there has been considerable month-to-month variability due to Kelvin wave activity. • During November- December 2009, the downwelling phase of a Kelvin wave contributed to an increase in heat content across the eastern half of the Pacific. • Since late December 2009, the heat content has increased across the east-central Pacific in association with the downwelling phase of another Kelvin wave. Time downwelling • Oceanic Kelvin waves have alternating warm and cold phases. The warmphase is indicated by dashed lines. Down-welling and warming occur in the leading portion of a Kelvin wave, and up-welling and cooling occur in the trailing portion. Longitude
Low-level (850-hPa) Zonal (east-west) Wind Anomalies (m s-1) Westerly wind anomalies (orange/red shading). Easterly wind anomalies (blue shading). From April-October 2009, the MJO was weak to nonexistent. Since May 2009, westerly wind anomalies have covered large portions of the equatorial Pacific, except near the Date Line. During November 2009, the MJO became active, which contributed to anomalous easterlies shifting eastward from the Indian Ocean to the central and eastern Pacific. Recently, anomalous low-level westerly winds have increased near the Date Line. Time Longitude
200-hPa Velocity Potential Anomalies (5ºN-5ºS) Positive anomalies (brown shading) indicate unfavorable conditions for precipitation. Negative anomalies (green shading) indicate favorable conditions for precipitation. During November, MJO activity was prevalent, but diminished during the first half of December. During July-October 2009 and since December 2010, the anomalous velocity potential pattern has generally featured upper-level divergence over the west-central Pacific (green) and upper-level convergence (brown) over the eastern Indian Ocean and western Maritime Continent. Time Longitude
Outgoing Longwave Radiation (OLR) Anomalies Drier-than-average conditions (orange/red shading) Wetter-than-average conditions (blue shading) Since mid-May 2009, convection has remained mostly suppressed over the eastern Indian Ocean and Maritime Continent. The pattern of OLR anomalies since late August 2009, generally featured suppressed convection around 120ºE and enhanced convection near the Date Line. This pattern is consistent with El Niño. Periodic MJO activity has also been evident in the eastward shift of OLR anomalies. Time Longitude
Oceanic Niño Index (ONI) • The ONI is based on SST departures from average in the Niño 3.4 region, and is a principal measure for monitoring, assessing, and predicting ENSO. • Defined as the three-month running-mean SST departures in the Niño 3.4 region. Departures are based on a set of improved homogeneous historical SST analyses (Extended Reconstructed SST – ERSST.v3b). The SST reconstruction methodology is described in Smith et al., 2008, J. Climate, vol. 21, 2283-2296.) • Used to place current events into a historical perspective • NOAA’s operational definitions of El Niño and La Niña are keyed to the ONI index.
NOAA Operational Definitions forEl Niño and La Niña El Niño: characterized by a positive ONI greater than or equal to +0.5°C. La Niña: characterized by a negative ONI less than or equal to -0.5°C. By historical standards, to be classified as a full-fledged El Niño or La Niña episode, these thresholds must be exceeded for a period of at least 5 consecutive overlapping 3-month seasons. CPC considers El Niño or La Niña conditions to occur when the monthly Niño3.4 SST departures meet or exceed +/- 0.5°C along with consistent atmospheric features. These anomalies must also be forecasted to persist for 3 consecutive months.
ONI (oC): Evolution since 1950 The most recent ONI value (October – December 2009) is +1.5oC. El Niño neutral La Niña
Historical El Niño and La Niña Episodes Based on the ONI computed using ERSST.v3b NOTE: After updating the ocean analysis to ERSST.v3b, a new La Niña episode was classified (ASO 1962- DJF 1962/63) and two previous La Niña episodes were combined into one single episode (AMJ 1973- MAM 1976).
Year DJF JFM FMA MAM AMJ MJJ JJA JAS ASO SON OND NDJ 1950 -1.7 -1.5 -1.3 -1.4 -1.3 -1.1 -0.8 -0.8 -0.8 -0.9 -0.9 -1.0 1951 -1.0 -0.9 -0.6 -0.3 -0.2 0.2 0.4 0.7 0.7 0.8 0.7 0.6 1952 0.3 0.1 0.1 0.2 0.1 -0.1 -0.3 -0.3 -0.2 -0.2 -0.1 0.0 1953 0.2 0.4 0.5 0.5 0.5 0.5 0.4 0.4 0.4 0.4 0.4 0.4 1954 0.5 0.3 -0.1 -0.5 -0.7 -0.7 -0.8 -1.0 -1.2 -1.1 -1.1 -1.1 1955 -1.0 -0.9 -0.9 -1.0 -1.0 -1.0 -1.0 -1.0 -1.4 -1.8 -2.0 -1.9 1956 -1.3 -0.9 -0.7 -0.6 -0.6 -0.6 -0.7 -0.8 -0.8 -0.9 -0.9 -0.8 1957 -0.5 -0.1 0.3 0.6 0.7 0.9 0.9 0.9 0.9 1.0 1.2 1.5 1958 1.7 1.5 1.2 0.8 0.6 0.5 0.3 0.1 0.0 0.0 0.2 0.4 1959 0.4 0.5 0.4 0.2 0.0 -0.2 -0.4 -0.5 -0.4 -0.3 -0.2 -0.2 1960 -0.3 -0.3 -0.3 -0.2 -0.2 -0.2 -0.1 0.0 -0.1 -0.2 -0.2 -0.2 1961 -0.2 -0.2 -0.2 -0.1 0.1 0.2 0.0 -0.3 -0.6 -0.6 -0.5 -0.4 1962 -0.4 -0.4 -0.4 -0.5 -0.4 -0.4 -0.3 -0.3 -0.5 -0.6 -0.7 -0.7 1963 -0.6 -0.3 0.0 0.1 0.1 0.3 0.6 0.8 0.9 0.9 1.0 1.0 1964 0.8 0.4 -0.1 -0.5 -0.8 -0.8 -0.9 -1.0 -1.1 -1.2 -1.2 -1.0 1965 -0.8 -0.4 -0.2 0.0 0.3 0.6 1.0 1.2 1.4 1.5 1.6 1.5 1966 1.2 1.0 0.8 0.5 0.2 0.2 0.2 0.0 -0.2 -0.2 -0.3 -0.3 1967 -0.4 -0.4 -0.6 -0.5 -0.3 0.0 0.0 -0.2 -0.4 -0.5 -0.4 -0.5 1968 -0.7 -0.9 -0.8 -0.7 -0.3 0.0 0.3 0.4 0.3 0.4 0.7 0.9 1969 1.0 1.0 0.9 0.7 0.6 0.5 0.4 0.4 0.6 0.7 0.8 0.7 1970 0.5 0.3 0.2 0.1 0.0 -0.3 -0.6 -0.8 -0.9 -0.8 -0.9 -1.1 1971 -1.3 -1.3 -1.1 -0.9 -0.8 -0.8 -0.8 -0.8 -0.8 -0.9 -1.0 -0.9 1972 -0.7 -0.4 0.0 0.2 0.5 0.8 1.0 1.3 1.5 1.8 2.0 2.1 1973 1.8 1.2 0.5 -0.1 -0.6 -0.9 -1.1 -1.3 -1.4 -1.7 -2.0 -2.1 1974 -1.9 -1.7 -1.3 -1.1 -0.9 -0.8 -0.6 -0.5 -0.5 -0.7 -0.9 -0.7 1975 -0.6 -0.6 -0.7 -0.8 -0.9 -1.1 -1.2 -1.3 -1.5 -1.6 -1.7 -1.7 Historical Pacific warm (red) and cold (blue) episodes based on a threshold of +/- 0.5 oC for the Oceanic Nino Index (ONI) [3 month running mean of ERSST.v3b SST anomalies in the Nino 3.4 region (5N-5S, 120-170W)], calculated with respect to the 1971-2000 base period. For historical purposes El Niño and La Niña episodes are defined when the threshold is met for a minimum of 5 consecutive over-lapping seasons.
Year DJF JFM FMA MAM AMJ MJJ JJA JAS ASO SON OND NDJ 1976 -1.6 -1.2 -0.8 -0.6 -0.5 -0.2 0.1 0.3 0.5 0.7 0.8 0.7 1977 0.6 0.5 0.2 0.2 0.2 0.4 0.4 0.4 0.5 0.6 0.7 0.7 1978 0.7 0.4 0.0 -0.3 -0.4 -0.4 -0.4 -0.4 -0.4 -0.3 -0.2 -0.1 1979 -0.1 0.0 0.1 0.1 0.1 -0.1 0.0 0.1 0.3 0.4 0.5 0.5 1980 0.5 0.3 0.2 0.2 0.3 0.3 0.2 0.0 -0.1 -0.1 0.0 -0.1 1981 -0.3 -0.5 -0.5 -0.4 -0.3 -0.3 -0.4 -0.4 -0.3 -0.2 -0.1 -0.1 1982 0.0 0.1 0.1 0.3 0.6 0.7 0.7 1.0 1.5 1.9 2.2 2.3 1983 2.3 2.0 1.5 1.2 1.0 0.6 0.2 -0.2 -0.6 -0.8 -0.9 -0.7 1984 -0.4 -0.2 -0.2 -0.3 -0.5 -0.4 -0.3 -0.2 -0.3 -0.6 -0.9 -1.1 1985 -0.9 -0.8 -0.7 -0.7 -0.7 -0.6 -0.5 -0.5 -0.5 -0.4 -0.3 -0.4 1986 -0.5 -0.4 -0.2 -0.2 -0.1 0.0 0.3 0.5 0.7 0.9 1.1 1.2 1987 1.2 1.3 1.2 1.1 1.0 1.2 1.4 1.6 1.6 1.5 1.3 1.1 1988 0.7 0.5 0.1 -0.2 -0.7 -1.2 -1.3 -1.2 -1.3 -1.6 -1.9 -1.9 1989 -1.7 -1.5 -1.1 -0.8 -0.6 -0.4 -0.3 -0.3 -0.3 -0.3 -0.2 -0.1 1990 0.1 0.2 0.2 0.2 0.2 0.2 0.3 0.3 0.3 0.3 0.3 0.4 1991 0.4 0.3 0.3 0.4 0.6 0.8 1.0 0.9 0.9 1.0 1.4 1.6 1992 1.8 1.6 1.5 1.4 1.2 0.8 0.5 0.2 0.0 -0.1 0.0 0.2 1993 0.3 0.4 0.6 0.7 0.8 0.7 0.4 0.4 0.4 0.4 0.3 0.2 1994 0.2 0.2 0.3 0.4 0.5 0.5 0.6 0.6 0.7 0.9 1.2 1.3 1995 1.2 0.9 0.7 0.4 0.3 0.2 0.0 -0.2 -0.5 -0.6 -0.7 -0.7 1996 -0.7 -0.7 -0.5 -0.3 -0.1 -0.1 0.0 -0.1 -0.1 -0.2 -0.3 -0.4 1997 -0.4 -0.3 0.0 0.4 0.8 1.3 1.7 2.0 2.2 2.4 2.5 2.5 1998 2.3 1.9 1.5 1.0 0.5 0.0 -0.5 -0.8 -1.0 -1.1 -1.3 -1.4 1999 -1.4 -1.2 -0.9 -0.8 -0.8 -0.8 -0.9 -0.9 -1.0 -1.1 -1.3 -1.6 2000 -1.6 -1.4 -1.0 -0.8 -0.6 -0.5 -0.4 -0.4 -0.4 -0.5 -0.6 -0.7 2001 -0.6 -0.5 -0.4 -0.2 -0.1 0.1 0.2 0.2 0.1 0.0 -0.1 -0.1 Historical Pacific warm (red) and cold (blue) episodes based on a threshold of +/- 0.5 oC for the Oceanic Nino Index (ONI) [3 month running mean of ERSST.v3b SST anomalies in the Nino 3.4 region (5N-5S, 120-170W)], calculated with respect to the 1971-2000 base period. For historical purposes El Niño and La Niña episodes are defined when the threshold is met for a minimum of 5 consecutive over-lapping seasons.
Year DJF JFM FMA MAM AMJ MJJ JJA JAS ASO SON OND NDJ 2002 -0.1 0.1 0.2 0.4 0.7 0.8 0.9 1.0 1.1 1.3 1.5 1.4 2003 1.2 0.9 0.5 0.1 -0.1 0.1 0.4 0.5 0.6 0.5 0.6 2004 2005 2006 2007 2008 2009 2010 2011 2012 2013 2014 2015 2016 2017 2018 2019 2020 2021 2022 2023 2024 2025 2026 2027 Historical Pacific warm (red) and cold (blue) episodes based on a threshold of +/- 0.5 oC for the Oceanic Nino Index (ONI) [3 month running mean of ERSST.v3b SST anomalies in the Nino 3.4 region (5N-5S, 120-170W)], calculated with respect to the 1971-2000 base period. For historical purposes El Niño and La Niña episodes are defined when the threshold is met for a minimum of 5 consecutive over-lapping seasons. 0.4 0.8 0.2 0.7 0.8 0.9 0.8 0.3 0.2 0.3 0.5 0.8 0.4 0.4 0.4 0.3 -0.1 -0.4 -0.7 0.7 0.4 0.4 0.4 0.2 0.5 0.5 0.6 0.1 0.2 0.9 1.1 -0.7 -0.6 -0.4 -0.1 0.3 1.1 0.8 0.4 0.1 -0.1 -0.1 -0.1 -0.1 -0.4 -0.7 -1.0 -1.1 -1.3 -0.6 -1.4 -1.1 -1.4 -0.6 -0.4 -0.1 0.0 -0.3 -0.8 0.0 0.0 -0.7 -0.5 0.2 0.7 0.9 1.2 1.5 -0.8 -0.1 0.6 0.8
Pacific Niño 3.4 SST Outlook • A majority of the models indicate that the current El Niño episode is near or at its peak (e.g. December-January-February). • After peaking, nearly all models indicate Niño-3.4 temperature departures will gradually decrease, with about half of the models indicating that El Niño will continue into April-May-June 2010. Figure provided by the International Research Institute (IRI) for Climate and Society (updated 19 Jan 2010).
SST Outlook: NCEP CFS Forecast Issued 31 January 2010 The CFS ensemble mean (heavy blue line) predicts El Niño will last through the Northern Hemisphere summer 2010. Please note the anomalies displayed above are not PDF corrected (they are biased corrected).
U. S. Seasonal OutlooksFebruary – April 2010 Temperature Precipitation The seasonal outlooks combine the effects of long-term trends, soil moisture, and, when appropriate, the ENSO cycle.
Summary • El Niño is present across the equatorial Pacific Ocean. • Sea surface temperatures (SST) are 1.0ºC- 2.5ºC above-average across much of the central and east-central equatorial Pacific. • Based on current observations and dynamical model forecasts, El Niño is expected to continue at least into the Northern Hemisphere spring 2010.
Typical US Temperature, Precipitation and Jet Stream Patterns during El Niño Winters
U.S. Precipitation Departures (mm) and Frequency of Occurrence (%) for El Niño during Nov.-Jan. FREQUENCY (right panel) indicates the percentage of El Niño years that the indicated departure (left panel) occurred. For example, above-average seasonal precipitation over eastern Texas occurred in 60%-80% of the El Niño years.
U.S. Temperature Departures (°C) and Frequency of Occurrence (%) for El Niño during Nov.-Jan.
U.S. Precipitation Departures (mm) and Frequency of Occurrence (%) for El Niño during Dec.-Feb.
U.S. Temp. Departures (°C) and Frequency of Occurrence (%) for El Niño during Dec.-Feb.
U.S. Precipitation Departures (mm) and Frequency of Occurrence (%) for El Niño during Jan.-Mar.
U.S. Temp. Departures (°C) and Frequency of Occurrence (%) for El Niño during Jan.-Mar.