Download
1 / 20
200 likes | 319 Views
Critical Electricity Pricing Issues. DME Portfolio Committee 23 May 2007. THE BRIEF. To address the committee on the following: Affordability, reliability and accesibility to electricity for all South Africans; The Eskom price increase of 18% - what informed this significant increase;

E N D
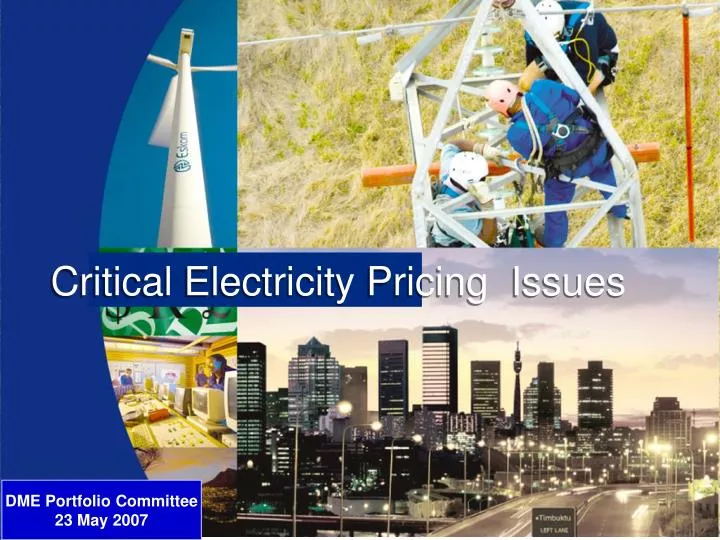
Critical Electricity Pricing Issues DME Portfolio Committee 23 May 2007
THE BRIEF To address the committee on the following: • Affordability, reliability and accesibility to electricity for all South Africans; • The Eskom price increase of 18% - what informed this significant increase; • The Eskom view on the pricing methodology developed by NERSA
Peak demand (MW) Reserve margin = 8-10% Reserve margin = 16% Reserve margin = 20% Reserve margin = 25% Reserve margin aspiration = 15%
Capacity expansion - driven by long term demand forecast Eskom position based on 4% growth electricity growth supporting 6% economic growth 77960 MW 56710 MW Eskom moderate position 2.3% electricity growth based economic growth of 4%
Capital Expenditure - R150bn Generation Transmission Distribution Corporate • 72% • Mothballed stations • 2 Coal base load stations • Hydro and gas options • Nuclear plant • Refurbishment • 14% • Lines and cables • Network improvements • Refurbishment • 12% • Network strengthening • Cater for growth • Refurbishment 2%
Capacity projects funnel Opportunity Identification Build Research Feasibility, Business Case, Contract Concluding Pre-feasibility 165 4500 PBMR 3500 1600 New Coal Supply 350 1150 Yankee Oscar 1500 1200 961 1775 100 1332 1600 600 UCG Lima Tango Komati Renewable 1 Discard Coal Ingula November 1200 Sierra India 100 1520 1128 Victor 900 2400 3000 6000 100 Grootvlei Camden Concentrating Solar Nuclear 1 Papa Co-Gen 1 Mike 4500 Gas 2 500 300 1050 Foxtrot 400 1000 4500 Zulu 2400 Quebec Arnot P1&P2 0 Cogeneration Hwange 500 Medupi Echo 1000 Delta HVDC 1 4500 Hydro 0 Coal 1 Hydro 1 600 4500 1050 Golf 1050 CBM 10000 Nuclear 350 Juliett Bravo Gas 1 1300 OCGT 2000 Nuclear n 500 1000 Gas Non Eskom Generation 1 Coal 2 Kilo Whiskey Hydro 2 Coal 765kV 400kV Solar 26 125 MW 22 650 MW 18 350 MW 11 941 MW Transmission Renewables * Red outer circle indicates – out of Borders project
2009 2009 2010 765 kV 400 kV Transmission projects 2009/10 for integration of project Alpha Matimba Botswana Mozambique Dinaledi PRETORIA KOMATIPOORT Marang Namibia WITBANK Mercury Swaziland Kudu Perseus 2009 Bloemfontein RICHARD'S BAY BLOEMFONTEIN 2007 DURBAN Eros Hydra 2009 DE AAR DE AAR 2009 Gamma Delphi Juno 2010 Neptune BEAUFORT WEST EAST LONDON Grassridge Omega PORT ELIZABETH CAPE TOWN
Funding strategy • 50% from retained earnings • 50% from debt of which • At least 25% from the domestic market • Long tenors (matches our assets), best value, no currency risk • Up to 25% from international markets • Various instruments - Export Credit Agency, Bonds, Private placements
Eskom’s credit rating Moody’s S&P Fitch Rating Status Foreign Currency A2 BBB+ - A- Local Currency A1 A - AA+ AAA Domestic Long-term A1 Domestic Short-term - A1+ Outlook Stable Stable Stable
Investment Grade • Investors require (per Rating Agencies): • Predictable regulatory framework with tariffs for efficient cost recovery • Asset security for loans: • Control over cash flows from an effective customer base • Confidence in the sustainability of critical capabilities: • Methods to protect all national capabilities – capital build, electrification, demand side management • Continuity of successful management: • Assurance of business continuity through competence & planned succession
Demand-side management • Targets: • 8 000 MW by 2025 • Investment of R10 billion planned by 2012, 3000MW • Focus areas • Installation of an energy saving culture • Adoption of energy efficient technologies e.g.. lighting • Tariff reform, particularly for households • Dynamic market pricing for industrial customers (DMP) • Use of renewable energy with households – Solar Water Heating • Approach to be followed • Aggressive roll-out planned nationally, with emphasis on areas with network constraints • Partnership between government, local authorities and Eskom
Our competitive advantage will continue into the future South Africa 30% cheaper than Australia Source NUS April 2006 Restricted and Confidential
Mining cost: Unpredictable cost inflation… 25.7% Most recent data from Stats SA • SA mining costs have increased by 25,7% since Oct. 2005. • SA coal costs (for SA consumption) have increased by 18,2% since Oct. 2005. 18.2% * Includes coal, metal ores, and other minerals Stats SA’s coal cost index was increasing at only 3,3% (year on year) at the time Eskom lodged its revenue application to the NER in 2005.
Price of Electricity in real c/kWh new Restricted and Confidential
Real price increases are not uncommon - Benchmarking Some recent price increases seen globally • Brazil – The Brazilian regulator Aneel has allowed a increase of domestic tariffs by 13%, and industrial tariffs by 18% primarily due to rising fuel costs. • Chile – The Chilean regulator INE has increased prices paid to generators by 11% in the central grid and 14% in the northern grid which will be passed through to customers. • Ireland – the Irish regulator CER has allowed for an increase in ESB’s end use prices by almost 20% in the New Year primarily driven by high fuel costs. • Portugal – The Portuguese regulator ERSE has provided an initial proposal to allow for a 15.7% increase to average tariff levels. • China - East China's Shandong Province, Huaneng Power recently raised tariffs by 7.3 per cent to 381.4 Yuan (US$47.03) per megawatt-hour (MWh), while in South China's Guangdong Province, the company raised prices by 6.2 per cent to 497.71 Yuan (US$61.37) per MWh. • Austria – The Austrian regulator E-Control has allowed price increases of about 5%, driven by an increase in the energy component of some 10%. • Ontario – where since cost reflective prices have been established starting in 2003, tariffs have increased by roughly 100%. Restricted and Confidential
Key Strategic Issues • Affordability • Industry viability • Internationally competitive prices
Conclusion • Achievement of the capacity expansion programme objectives is non negotiable • Eskom plan cater for higher economic growth • Eskom always ensure a long term view of the industry • Maintain our position of being the world’s lowest cost producer • South Africa to remain an attractive investment destination for energy intensive industry