Download
1 / 41
410 likes | 514 Views
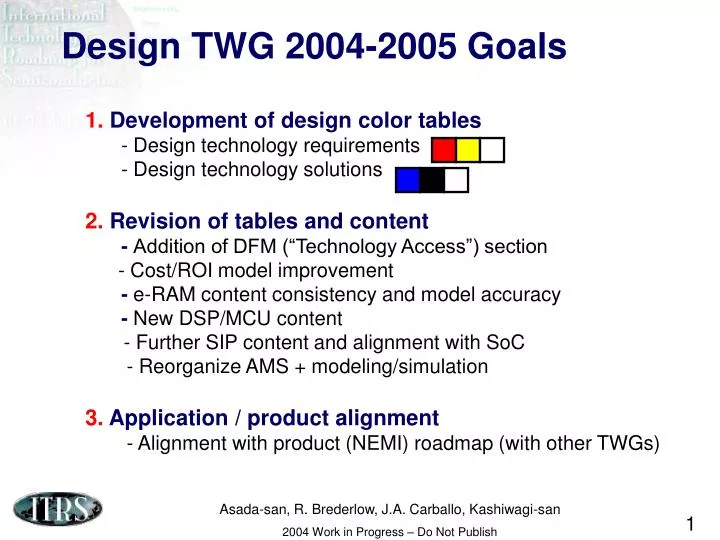
Design TWG 2004-2005 Goals. 1. Development of design color tables - Design technology requirements - Design technology solutions 2. Revision of tables and content - Addition of DFM (“Technology Access”) section - Cost/ROI model improvement

E N D
Design TWG 2004-2005 Goals 1. Development of design color tables - Design technology requirements - Design technology solutions 2. Revision of tables and content - Addition of DFM (“Technology Access”) section - Cost/ROI model improvement - e-RAM content consistency and model accuracy - New DSP/MCU content - Further SIP content and alignment with SoC - Reorganize AMS + modeling/simulation 3. Application / product alignment - Alignment with product (NEMI) roadmap (with other TWGs)
1. Design Color Table Development • Current requirements / solutions tables by • General • Design process • System level • Logic, circuit, and physical design • Verification • Test • Size ~ 50 requirements, 50 solutions
1. Design Color Table Development • Feedback summary (Japan) • Agree on definitions of productivity and power • Consistency / links with ORTC • Decomposition of requirements • Number of requirements and target audience • Alternative break-downs (by design objectives, by fabrics) • Feedback summary (Europe) • Clearly define each parameter • e.g. (1 sentence in e-RAM section • Choose driver (fabrics, app., objective) • Include that as comment to table rows or make extra row • Cost/area as requirement
1. Design Requirements Color Tables • General requirements
1. Design Requirements Color Tables • Design process requirements
1. Design Requirements Color Tables • System-level design requirements
1. Design Requirements Color Tables • Logic / circuit / physical design requirements
1. Design Requirements Color Tables • Verification requirements
1. Design Requirements Color Tables • Test requirements
1. Design Solutions Color Tables • Design process solutions
1. Design Solutions Color Tables • System-level design solutions
1. Design Solutions Color Tables • Logic, circuit and physical design solutions
1. Design Solutions Color Tables • Design verification solutions
1. Design Solutions Color Tables • Design test solutions
2. Design SIP content, SoC alignment • SIP • alignment and data issues • SoC • How to align with SIP, migration
3. Design "Technology Access" Section • Content • DFM • Libraries • Cost • CD variability survey? • Possible leads • Andrew Kahng (driver) • J. Mainard & S. Nassif (IBM) - unconfirmed
3. Design Possible Section Structure Simple “enumeration” of challenges Libraries/models DFM Cost
4. Design Embedding of Content • AMS • Elimination of separate AMS section • Incremental immersion of AMS content in document • Possible lead Peter • Modeling/simulation • Embed lone paragraph withing rest of document • Add to list of cross-cutting challenges
5. Design Cost/ROI model • Agreement on definition of cost • Additions of non-cost metrics • What metrics ROI? • How to get data • Possible leaders Smith, Carballo
6. System Drivers DSP/MCU content • From “F” to logic-sensible length scale (e.g., contacted M1). • Will impact SRAM A-factor model and logic density model • SRAM model • Recalibrate to the last few years of data (Dennis, Andrew) • Add more “design innovation” • Would increase chip white-space unless more “overhead” or • increase growth rate of SRAM and logic transistor counts • look at spreadsheet • Key questions • Is multi-core model (2X SRAM+logic per node) still OK? • Calibration data (e.g. 140mm2, 310mm2 still correct?) • Date of deployment and model implications of eDRAM • Redoing the MPU model = “server-desktop” vs. “mobile”
7. System Drivers e-RAM model • e-memory dynamic power roadmap • 2010 discontinuity • Review dynamic power calculation model (all memories) • e-memory static power roadmap • System Drivers value <> PIDS table+model value • Review leakage power calculation model • Impact of Vt variations? • FRAM • Widely used embedded, already integrated in SoC • Derive FRAM roadmap (like SRAM, FLASH, e-DRAM) • MRAM? • Flash • Andrew digging info on NOR-Flash
7. System Drivers e-RAM model • e-memory dynamic power roadmap • 2010 discontinuity problem was spreadsheet mistake • Review dynamic power calculation model (all memories) • e-memory static power roadmap • System Drivers value <> PIDS table+model value • Review leakage power calculation model • Impact of Vt variations? • FRAM • Widely used embedded, already integrated in SoC • Derive FRAM roadmap (like SRAM, FLASH, e-DRAM) • MRAM? • Flash • Andrew digging info on NOR-Flash
7. System Drivers e-RAM model/content • Consistency • Accuracy • Content • DRAM • SRAM • Flash
8. System Drivers Product Alignment (NEMI) • Will improve alignment with other documents • With systems chapter, based on each systems driver • With NEMI emulators, based on each NEMI emulator • Issues • Design organized by challenges and traditional EDA fields • Systems drivers based on “fabric/platform” • NEMI emulators based on “product”, NEMI is US organization • Actions (tentative) • Talk with NEMI about geographical composition • Aggressively improve each section’s alignment with s. drivers • Improve understanding of NEMI-ITRS drivers connection • Possible lead Andrew
8. System Drivers Product Alignment (NEMI) Drivers HP MT? SoC/SIP Architecture LC-LP NP Gaming Wireless PDA “BioChip” Applications (NEMI) MPU eMemory DSP AMS “MEMS” Fabrics (ITRS) “Futures” “Current”
8. System Drivers Product Alignment (NEMI?) Drivers High performance Low power NP Gaming Wireless PDA “BioChip” Applications (NEMI?) A4 A3 A2 A1 Architectures γ1 δ1 α1 β1 MPU eMemory DSP AMS “MEMS” Fabrics (ITRS) “Futures” “Current”
8. System Drivers Product Alignment (NEMI?) Parameter A1 A2 A3 A4 Year
8. System Drivers Product Alignment (NEMI) 0.18um / 400MHz / 470mW (typical) CPG PWR Processor PWM RTC 6.5MTrs. CPU FICP SSP Max 400MHz I-cache 32KB Sound D-cache 32KB I2C GPIO USB USB OST DMA controller MMC MMC I2S LCD Cnt. MEM Cnt. KEY UART AC97 Data Transfer 100MHz Peripheral LCD Flash 32MB SDRAM 64MB 4 – 48MHz • Example product • System Driver’s Reference Design • Personal digital assistant (PDA) • Composition • CPU • DSP • Peripheral I/O • Memory
Interaction With Other TWGs (PIDS, PIDS/Litho/FEP, Test, Assembly/Packaging, Yield)
Interaction With Other TWGs (PIDS, PIDS/Litho/FEP, Test, Assembly/Packaging, Yield)
Discussion on Cost Versus ROI Should we gather ROI trends? Appendix Material
Cost Versus ROE/ROI • Investor care about ROE Revenue A = D + E Cost/expense Assets Debt Interest/tax Equity Net profit . . / ROE
ROI versus Cost • Return On Investment a crucial metric • Cost is not the only variable! Investment (upfront cost) Revenue Cost n Rt - Ct ROI = - I + ∑ (1 + r)t t = 1 Time (years) Required return (risk)
DT Investment versus Overall costs • 2X EDA investment could half total design cost… • …if it achieves 7% more productivity growth 2X EDA investment ½ total cost
ROI Example • SoC
Cost versus ROI Impact of Time/productivity • TTM increases ROI, as it reduces time parameter 1. Higher revenues 2. Earlier revenues 3. Similar cost!
Cost versus ROI Impact of Uncertainty/Risk • Uncertainty lowers ROI, as it increases perceived risk