Download
1 / 3
30 likes | 138 Views
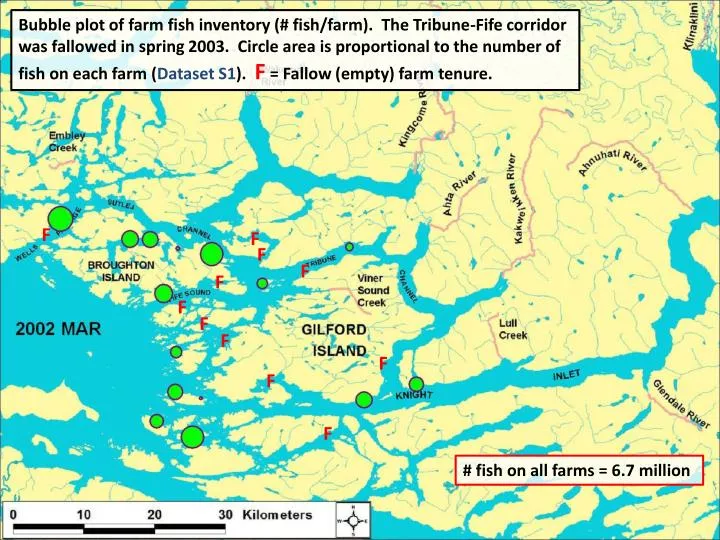
Bubble plot of farm fish inventory (# fish/farm). The Tribune-Fife corridor was fallowed in spring 2003. Circle area is proportional to the number of fish on each farm ( Dataset S1 ). F = Fallow (empty) farm tenure. F. F. F. F. F. F. F. F. F. F. F.

E N D
Bubble plot of farm fish inventory (# fish/farm). The Tribune-Fife corridor was fallowed in spring 2003. Circle area is proportional to the number of fish on each farm (Dataset S1). F = Fallow (empty) farm tenure. F F F F F F F F F F F # fish on all farms = 6.7 million
F F F F F F F F F F # fish on all farms = 7.1 million
F F F F F F F F F # fish on all farms = 7.2 million