Download
1 / 13
130 likes | 343 Views
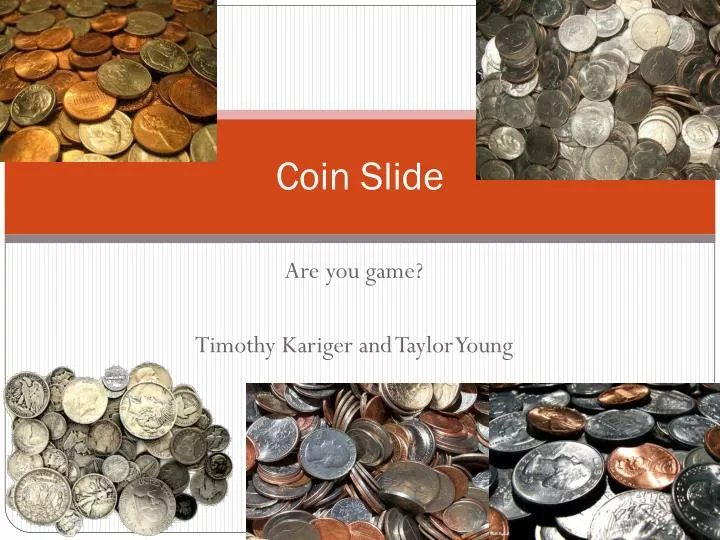
Coin Slide. Are you game? Timothy Kariger and Taylor Young. The procedure. Participants slide coins across a desk, trying to get the coin to stop in a goal zone marked by tape. Categories of data we recorded are: finger used to slide coin, gender, preferred coin, and number of coins landed.

E N D
Coin Slide Are you game? Timothy Kariger and Taylor Young
The procedure Participants slide coins across a desk, trying to get the coin to stop in a goal zone marked by tape. Categories of data we recorded are: finger used to slide coin, gender, preferred coin, and number of coins landed
Quantitative data Mean- 17.26 Min-4 Q1- 12 Median- 23 Max- 29 Roughly uni model Roughly symmetric
Normal model? Normal probability plot is linear Number of coins landed follows a normal distribution
Quantitative vs gender Quartiles for genders- Girls- Q1=11, Q3=23 Boys-Q1=12, Q3=23 Mean coins landed Girls- 17.18 Boys- 17.35 Median for girls: 19.5 Median for boys:16 Min and max (range) Girls- 6,26(20) Boys- 4, 29(25) 22 girls total 17 boys total
Finger used vs. Amount of coins landed Highest number of coins landed: 29 29 coins were landed in two different trials Both a pointer finger and a middle finger landed 29 coins More people used pointer fingers (31 to 8) Median number of coins landed: Middle- 18 Pointer- 19 Mean number of coins landed: Middle- 16.75 Pointer-17.39
Quantities data by partner Under Tim mean coins landed= 16.53 Median coins landed=16 Min=4 max= 29 Quartiles- Q1= 11, Q3= 23 Under Taylor Mean coins landed=17.7 Median coins landed=19.5 Min= 7 max= 29 Quartiles- Q1= 13, Q3=22.5
Marginal's % of preferred Dimes- 10.3 Nickels- 15.4 Pennies- 10.3 Quarters- 64.1 56.4% tested were female 43.5% tested were male
Conditionals Percent of females that preferred: Dimes- 18.2 Nickels- 22.7 Pennies- 4.5 Quarters- 54.5 Percent of males that preferred: Dimes- 0 Nickels- 5.9 Pennies-17.6 Quarters- 76.5
Conditionals %of pennies preferred by: Females-25 Males-75 % of nickels preferred by: Females- 83.33 Males-16.67 % of dimes preferred by: Females- 100 Males- 0 %of quarters preferred by: Females- 48 Males- 52
Independence between gender and preferred coin? • Conditions for Chi squared test for independence were not met • 2 Expected counts were not greater than 5 If Marginal of Gender=conditional of coins, then the two are independent But because the percentages of the conditionals are not similar, the two have some dependence.
Conclusion • Females were more consistent • Tim was a harder judge, the mean and median of his scores were lower • Quarters were most popular coin • Gender affects preferred coin • Lurking Variables- • Coins displayed to participants may not have been evenly distributed • Harshness of judge could affect number of coins landed