Download
1 / 41
410 likes | 485 Views
Geo-spatial Analysis in Transit Demand Estimation utilizing ITS Applications Peter Bang, Ph.D., AEI. GIS in Transit Conference October 16, 2013 Washington, DC. Contents. Introduction of This Study RTC’s ITS Applications GIS Analysis What We Found. Introduction of This Study.

E N D
Geo-spatial Analysis in Transit Demand Estimation utilizing ITS Applications Peter Bang, Ph.D., AEI GIS in Transit Conference October 16, 2013 Washington, DC
Contents • Introduction of This Study • RTC’s ITS Applications • GIS Analysis • What We Found
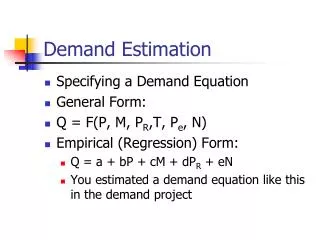
Introduction of This Study Current Transit Demand Estimation • Conventional Travel Demand Model • Simple Linear Est. based on Land Use, Route LOS, Historic Data • Sketchy Route Assignments by Experts, Surveys • Try and Error Adjustment based on Experts’ Expertise • Multiple non-linear Regression Est. with AVL, APC, & Parcel-Level Land Use Data
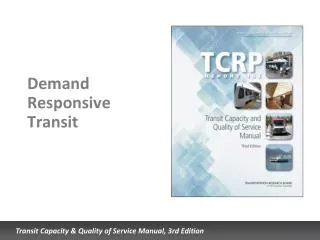
RTC’s Current ITS Application • Automatic Vehicle Location (AVL) on approximately 147 fixed-route, paratransit and supervisor vehicles • Automatic Passenger Counters(APC) • Transit Signal Priority (TSP) installed on at least 56 fixed-route vehicles • Computer-Aided Dispatch • Real-Time Traveler Information • Web based Trip Planning tool
Contents • Raw Data (with all the dots)
Demand Estimation I • All 575 Demand Points are IN; • = • (.000)* (.000)* • = 0.965 • = in .05 level significance
Demand Estimation I y = 88.631 + 4.8737·(# of Routes)3R² = 0.9652
Demand Estimation I 4th St. Station, 18 routes y = 88.631 + 4.8737·(# of Routes)3R² = 0.9652
Demand Estimation I 4th St. Station, 18 routes Meadowood Mall, 8 routes y = 88.631 + 4.8737·(# of Routes)3R² = 0.9652
Demand Estimation I 4th St. Station, 18 routes Meadowood Mall, 8 routes Centennial Plaza, 6 routes y = 88.631 + 4.8737·(# of Routes)3R² = 0.9652
Demand Estimation II = -51.615Ret8th (.001)* (.000)* (.000)* (.000)* (.000)* (.000)* (.008)* (.022)* = 0.592 = in .05 level significance Conditions ; SELECT IF (rank >= 4). SELECT IF (Num_Routes>= 2 ). SELECT IF (DU_8 > median ). SELECT IF (SUM_TOT > 0 ).
Demand Estimation II = -0.4 (.098)* (.000)* (.000)* Acre84 (.000)* (.004)* (.026)* = 0.632 = in .05 level significance Conditions ; SELECT IF (rank >= 4). SELECT IF (Num_Routes>= 2 ). SELECT IF (Emp_8 > median ). SELECT IF (SUM_TOT > 0 ).
Demand Estimation II = -11.5 (.066)* (.000)* (.000)* Acre84 (.003)* (.019)* = 0.623 = in .05 level significance Conditions ; SELECT IF (rank >= 4). SELECT IF (Num_Routes>= 2 ). SELECT IF (Emp_4 > median ). SELECT IF (SUM_TOT > 0 ).
Contents Future Routes Existing Routes
Further Study • Needs More Understanding on Data • Income, Captive Riders, Alternative Modes • New Mobility Indexes of Each Routes • Refined Accessibility Indexes of Each Stops • Transit LOSs ; Total Service Area, Fare System, Headways, etc.
Acknowledgement • Jeremy Smith, Lee Gibson, Amy Cummings • Tom Kowalski(UTA)
Q/A Thank You For Your Time !! Peter Bang, Ph.D. 202-366-2317