Download
1 / 1
10 likes | 88 Views
Future Elementary and Kindergarten Teachers’ Knowledge of Statistics and of its Didactics Raquel Santos, Escola Superior de Educação de Santarém , Portugal. Objectives: To analyze future elementary and kindergarten teachers’ knowledge of statistics and of its didactics;

E N D
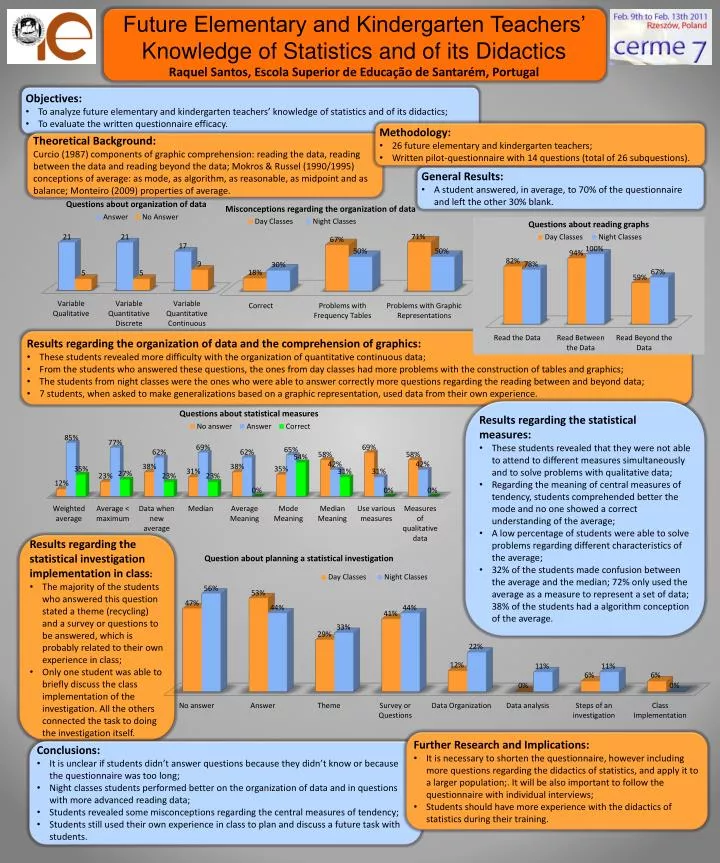
Future Elementary and Kindergarten Teachers’ Knowledge of Statistics and of its Didactics Raquel Santos, Escola Superior de Educação de Santarém, Portugal • Objectives: • To analyze future elementary and kindergarten teachers’ knowledge of statistics and of its didactics; • To evaluate the written questionnaire efficacy. • Methodology: • 26 future elementary and kindergarten teachers; • Written pilot-questionnaire with 14 questions (total of 26 subquestions). Theoretical Background: Curcio (1987) components of graphic comprehension: reading the data, reading between the data and reading beyond the data; Mokros& Russel (1990/1995) conceptions of average: as mode, as algorithm, as reasonable, as midpoint and as balance; Monteiro (2009) properties of average. • General Results: • A student answered, in average, to 70% of the questionnaire and left the other 30% blank. • Results regarding the organization of data and the comprehension of graphics: • These students revealed more difficulty with the organization of quantitative continuous data; • From the students who answered these questions, the ones from day classes had more problems with the construction of tables and graphics; • The students from night classes were the ones who were able to answer correctly more questions regarding the reading between and beyond data; • 7 students, when asked to make generalizations based on a graphic representation, used data from their own experience. • Results regarding the statistical measures: • These students revealed that they were not able to attend to different measures simultaneously and to solve problems with qualitative data; • Regarding the meaning of central measures of tendency, students comprehended better the mode and no one showed a correct understanding of the average; • A low percentage of students were able to solve problems regarding different characteristics of the average; • 32% of the students made confusion between the average and the median; 72% only used the average as a measure to represent a set of data; 38% of the students had a algorithm conception of the average. • Results regarding the statistical investigation implementation in class: • The majority of the students who answered this question stated a theme (recycling) and a survey or questions to be answered, which is probably related to their own experience in class; • Only one student was able to briefly discuss the class implementation of the investigation. All the others connected the task to doing the investigation itself. • Further Research and Implications: • It is necessary to shorten the questionnaire, however including more questions regarding the didactics of statistics, and apply it to a larger population;. It will be also important to follow the questionnaire with individual interviews; • Students should have more experience with the didactics of statistics during their training. • Conclusions: • It is unclear if students didn’t answer questions because they didn’t know or because the questionnaire was too long; • Night classes students performed better on the organization of data and in questions with more advanced reading data; • Students revealed some misconceptions regarding the central measures of tendency; • Students still used their own experience in class to plan and discuss a future task with students.