Download
1 / 37
370 likes | 527 Views
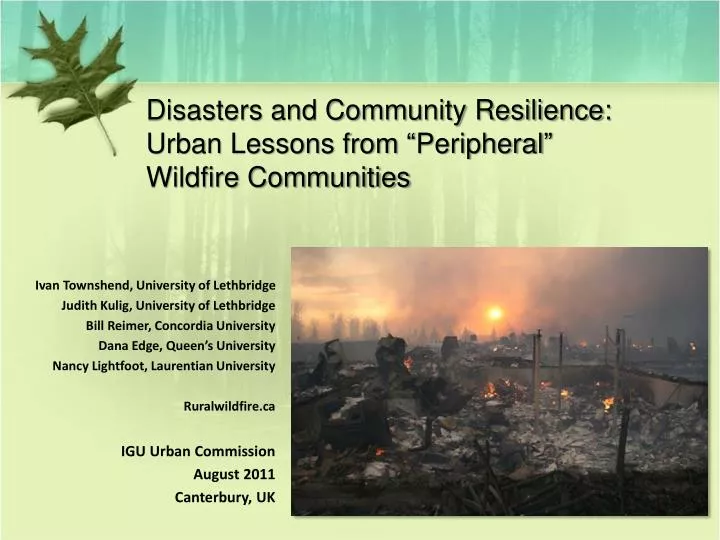
Disasters and Community Resilience: Urban Lessons from “Peripheral” Wildfire Communities. Ivan Townshend, University of Lethbridge Judith Kulig, University of Lethbridge Bill Reimer, Concordia University Dana Edge, Queen’s University Nancy Lightfoot, Laurentian University Ruralwildfire.ca

E N D
Disasters and Community Resilience: Urban Lessons from “Peripheral” Wildfire Communities Ivan Townshend, University of Lethbridge Judith Kulig, University of Lethbridge Bill Reimer, Concordia University Dana Edge, Queen’s University Nancy Lightfoot, Laurentian University Ruralwildfire.ca IGU Urban Commission August 2011 Canterbury, UK
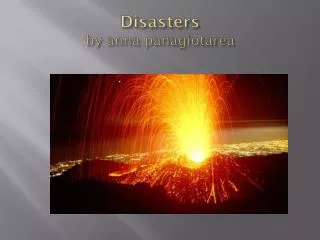
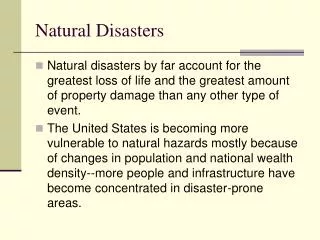
Background • Natural hazards widespread and increasing in number and intensity • Blizzards • Earthquakes • Floods • Hail • Icebergs, sea ice and fog • Landslides and snow avalanches • Tornadoes • Tsunamis and storm surges • Volcanic eruptions • Forest Fire etc.
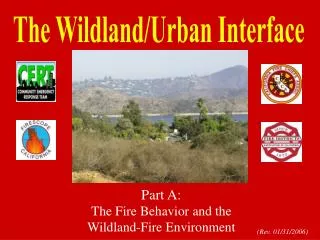
Background • Wildfire disasters increasing in number and intensity (Walter 2004) • Fire disasters linked to: • Climate change • Insect infestation (e.g. pine beetle) • Human habitat (e.g. residential development in wildland-urban interface zones, urban periphery, etc.)
Background • Impact of Wildfires in Canada: • From 1995 – 2005 over 700,000 people and over 250 communities have been threatened by wildfires (Public Safety & Emergency Preparedness Canada, 2005) • Urban and Rural impacts 11,231 fires in LFDB 1959-1999
Background • Recent Events in Alberta: • Slave Lake Fire (2011): • Over 40% of the town destroyed • Evacuation • Confusion, anger, despair, etc.
Background • Significant Human Impacts: • Health issues • Physical health • Mental health • Community health • Significant Monetary and Social Costs: • E.g. $9-12 million cost of health impacts due to poor air quality related to major wildfires) (Rittmaster, Adamowicz, Amiro & Pelletier, 2006) • Social disruption, stress, community viability, loss of livelihoods, etc.
Key Geographical Issues • Variability in disaster impacts • Variability in physical / mental health & well being • Variability in coping strategies • Variability in community capacity to deal with the issues • Variability in ability to rebuild, move forward, etc. • “Geographies” of Resiliency • How do we better understand this link between disasters (e.g. Wildfires, Tsunami, Flood, Riots) and RESILIENCY
Linking Resiliency & Disasters • Disaster & insurance agencies use resiliency as a framework to help re-build communities • Canadian & US governments using resiliency as policy frameworks (especially post-Katrina / post-911) • Resiliency as a Social Process and a Community Process Mallard Fire, 1999
On the Question of Resiliency • What is resiliency? • How can we measure perceptions of resiliency? • How does perceived resiliency differ within and between communities? • How is resiliency linked to health, community engagement, etc? • How can we better understand the social / community dynamics that explain or promote resiliency, or perceived resiliency? • What are the links with PSOC / Cohesion etc.
Resiliency and Cohesion • Numerous studies and conceptual frameworks draw attention to resiliency-cohesion linkages (or some features of each). • Still inconsistencies in definitions / measurements etc. • E.g. resiliency or specialized features of resiliency (e.g. engagement) • Cohesion vs SOC etc. (sometimes conflated) • Few have captured the “social” or “community” basis of resiliency. But there is progress in this area…
Resiliency as a Social Process Figure 1. Updated Community Resiliency Model Kulig et al (2007)
Our Study Builds Upon these Ideas 3 yr SSHRC project: Resiliency in Rural Settlements that have experienced Wildfires: Implications for Disaster Management and Mitigation McLure Fire, Barriere BC, 2003 The 2003 McLure Fire, • Mallard Fire, 1999, • La Ronge Saskatchewan
Study Communities • Barriere, BC Pop approx 7000in valley (McLure Fire 2003) >3800 evacuated HHLD survey n=202 • La Ronge, SK Pop approx 6000(Mallard Fire 1999) >1000 evacuated HHLD survey n=111 • Controls: Coaldale and RMH HHLD survey n=188
Mixed Methods Study • Qualitative Interviews (n = 57) • Community Profiles • Household Survey (over 200 items, evacuation info, resources used, health, community, social capital, cohesion, resilience etc. ) • Sampling strategy: • Electronic phone book • Geocoding by P Codes • GIS overlays 1km x 1 km • n = 313 in participating communities • n = 145 in control communities McLure Fire, BC
Measuring Perceived Resilience • Develop an index based on existing conceptual / theoretical / empirical work. • Index should include different facets of resilience, etc. + other approaches
Original 15 Item Perceived Resiliency Scale Scale = 15 - 75
Modified Perceived Resiliency Scale (11 Items) Modified following external review of item validity “Health” items Removed Scale = 11 - 55
Modified “Perceived Resiliency” Scale (11 Items) Scale Analysis Scale = 11 - 55 n=492, (Barriere, La Ronge, Control)
Structure (Subscales) of the Index of Perceived Community Resiliency 24.2% 20.9% 12.8% (58%) 1. Leadership and Empowerment 2. Community Engagement 3. Non-Adverse Geography Min communality = 0.4 Peripherality?
Measuring Cohesion • Buckner’s Index of Cohesion • Robust 18-item index (5 point Likert scale). • Replicated in a number of studies (e.g. Wilkinson 2007, Townshend 2002, etc). • Includes multiple facets of cohesion (e.g. Neighboring, PSOC, Attachment, etc.) • Useful measure of cohesion as a socio-spatial concept.
Buckner’s 18 Item Cohesion Index Structure (subscales) of Cohesion. (Buckner 1988, Wilkinson 2007 etc.) 1. PSOC 2. Nhood Attraction 3. Neighboring
Empirical Structure (subscales) of Cohesion from our Study 23.8% 18.5% 14.5% (57%) Structure very similar to Buckner 1998, Wilkinson 2007 etc. 1. PSOC 2. Nhood Attraction 3. Neighboring
Perceived Resilience and Cohesion amongst Individuals IPCR 1. Leadership and Empowerment 2. Community Engagement 3. Non-Adverse Geography ? linkages 3. Neighboring 1. PSOC 2. Nhood Attraction Cohesion
Significant Correlation Bonds Pearson’s r, p<0.05, n=476 IPCR .11 1. Leadership and Empowerment 2. Community Engagement 3. Non-Adverse Geography .46 .24 .17 .12 .15 .50 .14 .23 .50 .13 3. Neighboring 1. PSOC 2. Nhood Attraction .50 .13 Cohesion
Dominant Path IPCR 1. Leadership and Empowerment 2. Community Engagement 3. Non-Adverse Geography 3. Neighboring 1. PSOC 2. Nhood Attraction Cohesion
Implications • Perceived Resilience and Cohesion are both multidimensional constructs • It may NOT be necessary to deal with this type of complexity when studying community resilience (cf. Cutter’s SOVI index etc.) • Selected subscales of perceived resilience and cohesion can be isolated (simpler explanatory framework, simpler survey design etc.)
Going Beyond Resilience and Cohesion • E.g. Health & Well Being
Going Beyond Resilience and Cohesion • E.g. Behavior, Cognition, Affect, Social Capital, etc.
Other Findings from this study… • What Enhances Resiliency? • Positive, proactive attitude • Leadership • Volunteerism • Sense of belonging , PSOC, etc. • Affective traits are key. • What Hinders it? • Lack of personal resources i.e., money • Lack of leadership • Lack of opportunity to debrief as a community
Research & Policy Challenges Ahead • Are there “universal” drivers of resiliency? • Policies to enhance or promote resiliency. • Mechanisms for identifying “community-specific” drivers of resiliency. • Equipping communities to identify these and develop local initiatives to promote these • Understanding of how resiliency varies through space and time (Geographies of resilience). • Policies that connect the appropriate linkages…e.g. PSOC > Engagement > Resiliency • How does perceived resilience translate into actual resilience? • Problems of governance and coordination from afar, etc.
Urban Lessons to be Learned from the “periphery” • Community (rural or urban) matters for resilience • (e.g. PSOC > Engagement > Resilience) • Urban neighbourhoods and communities also vulnerable to disasters / evacuation, etc. • Social processes are key to resilience / recovery • “Local” knowledge / involvement is paramount • We need “intra-urban” studies of resiliency potential
Sharing our Findings… 1:3:25 Report Lessons Learned Booklets Technical reports on the household survey Digital Stories on youtube.com: search for McLure Wildfire Ruralwildfire.ca
Additional work… • Morris, MB • (Spring 2011 flood evacuation alert). • Slave Lake, AB • Special emphasis on social processes of resilience amongst children • ACCFCR (Alberta Centre for Child, Family, and Community Research) + AET (Alberta Gov)
Acknowledgements • Social Sciences and Humanities Research Council of Canada (SSHRC) • Community members • Research assistants • Community advisory board members • Research advisory members • Provincial agencies (SRD and Ministry of Forests)