Download

1 / 98
1.04k likes | 1.19k Views
Urban Patterns. Chapter 13. Urbanization. Def .- the process by which the pop. of cities grows Made up of 2 factors An increase in the # of people living in cities An increase in the % of people living in cities 2 factors occur for diff. reasons and have diff. global distributions.

E N D
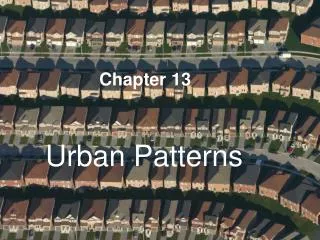
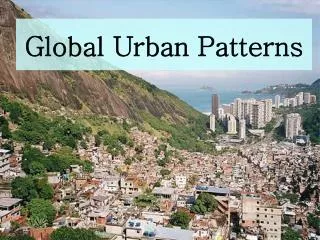
Urban Patterns Chapter 13
Urbanization • Def.- the process by which the pop. of cities grows • Made up of 2 factors • An increase in the # of people living in cities • An increase in the % of people living in cities • 2 factors occur for diff. reasons and have diff. global distributions
continued • In 1800, only 3% of World pop. lived in cities and Beijing was the only city with more than 1 million • Today ½ of pop. lives in cities and more than 400 cities have at least 1 million people
Increasing Percentage of People in Cities • 3% in 1800 • 6% in 1850 • 14% in 1900 • 30% in 1950 • 47% in 2000 • 2008 urban % surpassed rural for first time in human history
continued • In MDCs, ¾ live in cities • In LDCs, 2/5 live in cities • Exception is in Latin America—closely resembles pattern of MDCs • Higher % in MDCs due to industrial revolution in 19th Century and growth of service industries in the 20th
continued • In MDCs the need for fewer farm workers has pushed people to cities to find work • Lure of factory jobs and now service jobs has pulled them into urban areas • Led to increase in % of people living in urban areas and a decrease in % of people living in rural areas—Duh!
Continued • Process of urbanization in MDCs began around 1800 and has pretty much ended • The % living in urban area can’t increase much more • People who wanted to do it already have • MDCs are considered fully urbanized
continued • In LDCs the % has risen rapidly in recent years • People come looking for manufacturing or service jobs due to declining farming opportunities • Urban jobs are not assured in LDCs to those who migrate—stage 2 Demographic transition model—very high population growth
Buenos Aires, Argentina Buenos Aires, Argentina
Increasing # of People in Cities • 8 of 10 largest cities are in LDCs • NY and Tokyo are the only exceptions • In 1900, 6 would have been in Europe and three in the US
continued • Rapid growth of cities in LDCs not because of industrialization or an improved level of development • ½ comes from migration for countryside for job opportunities that may not even exist • ½ comes from high natural increase rates • In African cities, natural increase accounts for 3/4
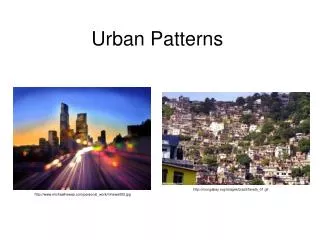
Defining Urban Settlements • Not an easy thing today • Top ten lists vary depending on the publication because of differing definitions of the word urban • 2 important factors in distinguishing between urban and rural—social factors and physical factors
Social Differences Between Urban and Rural • Louis Wirth 1930s • Different way of life for urban dwellers • Defined city as a permanent settlement with 3 characteristics • Large size • High pop. density • Socially heterogeneous people
Large size • People know only a small % of pop. • People have specific roles and most people you do know is according to those roles • Ex. I’m your teacher • Leads to a different set of social relationships
High Density • Leads to specialization • Each person in urban area has a specified role that allows the complex urban structure to function smoothly • Leads to competition of limited resources for survival
Social Heterogeneity • Larger the settlement, the greater the variety of people • More freedom to pursue “different” things • Unusual jobs, homosexuality, cultural interests • More accepted in large urban areas • Despite freedom, many feel lonely or isolated in urban settlements • Surrounded by indifferent people
Wirth Definition Today • Really only applies to LDCs • Everyone in MDCs lives urban lifestyles • Urban jobs, cars, telephones, TV are available to all in MDCs
Physical Definitions of Urban Settlements • Used to be easy—cities were walled • Today there are 3 ways to physically define an urban settlement • By legal boundary • As a continuously built-up area • As a functional area
Legal Definition of a City • City- an urban settlement that has been legally incorporated into an independent, self-governing unit • Has locally elected officials, ability to raise taxes, and provides certain services to residents • Boundaries of city are the limit to the local gov. authority • In the US, a city surrounded by suburbs is often called a central city
Urbanized Area • In the US, the central city and surrounding suburbs are called an urbanized area • Pop. Density must exceed 1000 per sq. mile • 70% of US residents live in an urbanized area • 30% in central cities and 40% in suburbs • Difficult to work with this definition, because few statistics are available for them
Metropolitan Statistical Area • Used because it more fully reflects the influence of an urban settlement beyond its legal boundaries • Watching TV stations, reading newspapers, supporting sports teams, etc. • Created by US Census Bureau to measure functional area of a city
continued • Metropolitan Statistical areas include the following: • An urbanized area with pop. of at least 50,000 • The county within which the city is located • Adjacent counties with high pop. Density and a large % of residents working in the central city’s county
continued • 362 MSAs in the US in 2003—83% of pop. • MSAs are not perfect analysis tools • Also include extensive land area that isn’t urban
continued • Micropolitan statistical area- an urbanized area of b/w 10,000 and 50,000 residents, the county in which it is found, and adjacent counties tied to the city • 560 in 2003—10% of pop • Mostly in area of South and West that used to be rural
Overlapping Metropolitan Areas • Sometimes MSAs overlap • A county in between might send large # of residents to work in both areas • In the NE US, MSAs are so close together they now form one continuous urban complex • Called Megalopolis– Boston to DC • Some call Boswash or Bosnywash
continued • Other continuous urban complex exist as well • Between Chicago and Milwaukee to Pittsburgh • Los Angeles to Tijuana
Three Models of Urban Structure • Created to help explain where different types of people tend to live in an urban area • All three were created using Chicago as the model • Concentric Zone Model • Sector Model • Multiple Nuclei Model
Concentric Zone Model • Created 1923– Sociologist E. W. Burgess • Def.- a model of the internal structure of cities in which social groups are spatially arranged in a series of rings
continued • 5 zones • CBD – central business district • Innermost ring- concentration of non-residential activities • Zone in Transition • Industry and poorer-quality housing • Often subdivided apartment houses • Often filled by immigrants
continued • Zone of Working Class Homes • Modest older houses occupied by stable families • Zone of Middle Class Homes • Newer and more spacious homes • Commuter’s Zone • Area of people who don’t live in city where they work
Sector Model • Created in 1939 by economist Homer Hoyt • Def. – a model of internal structure of cities in which social groups are arranged around a series of sectors, or wedges, radiating out from the CBD • Certain areas of cities are more attractive for various activities • Due to chance or environmental factors originally
continued • As city grows, activities spread outward in wedges/sectors from the center • Once a high rent housing district is established, the more expensive new housing grows on the outer edge of that sector • Best housing found in a corridor extending from downtown to outer edge of city • Industrial and retail activities develop in other sectors—usually along good transportation lines
Multiple Nuclei Model • Created in 1945 by geographers C. D. Harris and E. L. Ullman • Def.- a model of internal structure of cities in which social groups are arranged around a collection of nodes of activities • Cities are complex and include more than one center around which activities revolve • Ex. Ports, neighborhood business centers, universities, airports, parks
continued • Some activities are attracted to particular nodes, whereas others try to avoid them • Bookstores and pizza joints tend to cluster around Universities • Hotels and warehouses around airports • High-class housing rarely in same neighborhood as manufacturing