Download
1 / 54
540 likes | 711 Views
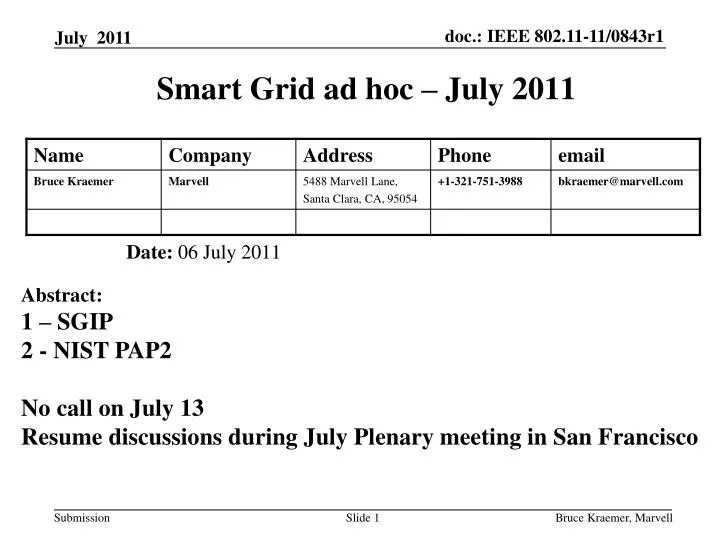
Smart Grid ad hoc – July 2011. Date: 06 July 2011. Abstract: 1 – SGIP 2 - NIST PAP2 No call on July 13 Resume discussions during July Plenary meeting in San Francisco. SGIP. SGIP Monthly Report. Prepared by: SGIP Plenary Leadership and SGIP PMO

E N D
Smart Grid ad hoc – July 2011 Date:06 July 2011 Abstract: 1 – SGIP 2 - NIST PAP2 No call on July 13 Resume discussions during July Plenary meeting in San Francisco Bruce Kraemer, Marvell
SGIP Bruce Kraemer, Marvell
SGIP Monthly Report Prepared by: SGIP Plenary Leadership and SGIP PMO Report covers activities for May, 2011 http://collaborate.nist.gov/twiki-sggrid/pub/SmartGrid/PMO/2011-05_SGIP_Monthly_Report_FINAL_V1.0.pptx
Standards Being Addressed by PAPs April 2011 Activities - PMO Monthly Report
Upcoming SGIP Governing Board Meetings (attendance not required) DateTimeLocationRegistration July 11 & 12 Informational: 6:30pm to 9:00pm Eastern; Business: 8am to 11:30am Eastern Part of the Summer Face-to-Face, Montreal, QC. Sept. 8 1pm to 4pm Eastern Virtual Nov. 10 1pm to 4pm Eastern Virtual Dec. 5 8am to Noon Local Part of the Winter Face-to-Face, Phoenix, AZ Bruce Kraemer, Marvell
Upcoming Governing Board Votes • CoS Process – Vote ended May 12, Approved • PAP 04 – July, 2011 – OASIS WS-Calendar • PAP 05 – July, 2011 – AEIC Metering Guideline • PAP 11 – July, 2011 – Communication between Plug-in Vehicles and the Utility Grid • PAP 12 – July, 2011 – IEEE 1815 (DNP) • PAP 15 – July, 2011 – Broadband PLC standards (IEEE and ITU-T) • Upcoming Plenary Membership Votes • PAP 00 – NEMA Meter Upgradability Standard • PAP 01 – Role of IP in the Smart Grid • PAP 02 –Wireless Guidelines NISTIR • PAP 10 – Standard Energy Usage Information • PAP 11 – SAE J1772 - Electric Vehicle and Plug in Hybrid Electric Vehicle Conductive Charge Coupler • PAP 11 – SAE J2836 - Use Cases for Communication Between Plug-in Vehicles and the Utility Grid • 2011 SGIP Meetings • F2F Meetings • July 12-14: Face-to-Face in Montreal • December 5-8: Face-to-Face in Phoenix • Virtual Meetings: • May 26; Sep 16; Nov 10 • Additional Major Activities and Milestones • NIST Framework V2 collaboration/development/input with SGIP organizations • Identifying key testing and certification programs to address in 2011 • Creating conceptual architecture based on prior work; conceptual model, national goals workshops, and requirements workshops Key SGIP Program Activities http://collaborate.nist.gov/twiki-sggrid/pub/SmartGrid/PMO/2011-04_SGIP_Monthly_Report_FINAL_V1.0.pptx April 2011 Activities - PMO Monthly Report
April 2011 Timeline Status Milestone: GB PAP Initiation Milestone: SSO Identified Milestone: Requirements Handoff Milestone: GB/SGIP Vote Milestone: Plenary Vote Milestone: Post to Catalog or IKB Milestone: Close PAP Milestone: Standards Handback Reviews: PAP, CSWG, SGAC, PMO GB Recommendation Plenary Decision Develop Requirements SSO Standards Development GB Decision PAPWG Startup PAP Closure Paperwork Note: Some PAPs are in multiple places due to the status of separate standards they are involved in. http://collaborate.nist.gov/twiki-sggrid/pub/SmartGrid/PMO/2011-04_SGIP_Monthly_Report_FINAL_V1.0.pptx April 2011 Activities - PMO Monthly Report
PAP StopLight Status http://collaborate.nist.gov/twiki-sggrid/pub/SmartGrid/PMO/2011-04_SGIP_Monthly_Report_FINAL_V1.0.pptx April 2011 Activities - PMO Monthly Report
PAP Planned Completions by Quarter http://collaborate.nist.gov/twiki-sggrid/pub/SmartGrid/PMO/2011-04_SGIP_Monthly_Report_FINAL_V1.0.pptx April 2011 Activities - PMO Monthly Report
PAP 13: IEEE PC 37.238, IEEE 1588, and IEEE 61850-90-5 will complete in May. PAP 18: SEP 1.0, 1.1, and 2.0. Having issue getting the right copies of SEP 1.0 and 1.1. CSWG actively participating in PAP 18. PAP 11: SAE J2847 needs updated final review. Awaiting SAE to provide approved version to post to ANSI portal. PAP 15 (broadband requirements): IEEE 1901 and ITU-T G9972. Awaiting IEEE to provide approved copy of 1901 to post to ANSI portal. Also awaiting assistance from a representative to assist CSWG in exact scope of IEEE 1901 used in PAP 15. PAP 12: IEEE 1815 (DNP3). Ready for review, but is low in queue. PAP 16: IEC 61400-25 review requested, but CSWG awaiting details on which parts to review since there are many parts. CSWG Standards Review Queue April 2011 Activities - PMO Monthly Report
NIST PAP#2 History Abstract: This work area investigates the strengths, weaknesses, capabilities, and constraints of existing and emerging standards-based physical media for wireless communications. The approach is to work with the appropriate standard development organizations (SDOs) to determine the characteristics of each technology for Smart Grid application areas and types. Results are used to assess the appropriateness of wireless communications technologies for meeting Smart Grid applications. http://collaborate.nist.gov/twiki-sggrid/bin/view/SmartGrid/PAP02Wireless Bruce Kraemer, Marvell
PAP2 Links • PAP02: Wireless Communications for the Smart Grid (6.1.5) • Contents of this topicUseful Hot LinksAbstract: • Status of PAP02: Wireless Communications for the Smart Grid (6.1.5) • Task Details: • Description: • Objectives: • Why: • Where: • Who: • 2011 Upcoming Meetings • May 10 - Teleconference 2:30pm ET • May 24, June 7, June 21, July 5, July 19, Aug 2, Aug 16, Aug 30 - Teleconference 2:00pm ET • July 12-14, 2011 - SGIP Summer Meeting, Montreal Canada Bruce Kraemer, Marvell
Subscription to NIST PAP#2 • To see the complete NIST Priority Action Plan list go here: • http://collaborate.nist.gov/twiki-sggrid/bin/view/SmartGrid/PriorityActionPlans#Individual_PAP_Lists • To subscribe to PAP#2 mailing list go here: • http://www.smartgridlistserv.org/cgi/wa.exe?SUBED1=SGIP-PAP02WG&A=1 Bruce Kraemer, Marvell
OpenSG • SharePoint Documents • http://osgug.ucaiug.org/UtiliComm/Shared%20Documents/Forms/AllItems.aspx Bruce Kraemer, Marvell
Draft 0.5 July 28, 2010 August 4, 2010 Call for Input to Section 6 September 15, 2010 End of draft 0.5 review period SGIP face-to-face, St Louis Tentative PAP 2 meeting September 16, 2010 NIST Timeline (Anticipated) August , 2009 Project initiation September 30, 2010 Release of draft 0.6 October 29, 2010 End of draft 0.6 review period November 4, 2010 OpenSG + PAP2 meeting, Fort Lauderdale Extended edit period December 3, 2010 Release of Version 1 January 15, 2011 Continuation of project to extend findings Release of Version 2 ? June/July 2011 ? Bruce Kraemer, Marvell
PAP#2 Version 1 • Guideline for Assessing Wireless Standards for Smart Grid Applications • Version 1.0 released Jan 13, 2011 • http://collaborate.nist.gov/twiki-sggrid/pub/SmartGrid/PAP02Objective3/NIST_PAP2_Guidelines_for_Assessing_Wireless_Standards_for_Smart_Grid_Applications_1.0.pdf Bruce Kraemer, Marvell
Priority Action Plan for Wireless communications (PAP#2) Activity Summary Calls every two weeks – details on NIST Twiki Version 1 paper approved by SGIP board Procedures approved Current primary task is to qualify a propagation model that can be used for metering applications This task will extend to at least thru May 10th Next proposed task will be to re-work Section 4 - on the Matrix material Bruce Kraemer, Marvell
14 voters, 12 yes, 0 no, 0 abs, 2 dnv PAP#2 Procedures approved http://collaborate.nist.gov/twiki-sggrid/bin/view/SmartGrid/PAP02Wireless Bruce Kraemer, Marvell
Next PAP 2 meetings Next face-to-face meeting SGIP meeting July 12-14, Montreal Canada Logistics available here: http://collaborate.nist.gov/twiki-sggrid/bin/view/SmartGrid/SGIPCalendar PAP 2 conference call schedule Bruce Kraemer, Marvell
2011 NIST PAP2 Meeting History http://collaborate.nist.gov/twiki-sggrid/bin/view/SmartGrid/PAP02Wireless Bruce Kraemer, Marvell
NIST PAP#2 Previous Work May 24 - Teleconference 2:00pm ET Agenda & Presentation Detailed Framework Proposal (Cunningham) June 7, June 21, July 5, July 19, Aug 2, Aug 16 - Teleconference 2:00pm ET July 12-14, 2011 - SGIP Summer Meeting, Montreal Canada http://collaborate.nist.gov/twiki-sggrid/pub/SmartGrid/PAP02Wireless/Presentation_05242011.pptx http://collaborate.nist.gov/twiki-sggrid/pub/SmartGrid/PAP02Wireless/Frmwrk-Tool-Dtls-r0.1.xls http://collaborate.nist.gov/twiki-sggrid/bin/view/SmartGrid/PAP02Wireless Bruce Kraemer, Marvell
The following is derived from a discussion conducted in the IEEE 802 meetings held May 9-13. The document used during the meeting can be found at: https://mentor.ieee.org/802.11/dcn/11/11-11-0720-02-0000-smart-grid-ad-hoc-may-2011.ppt These slides further explain the understanding on what is being asked for in the Framework document and provides some views on how those requirements might be fulfilled. PAP2 Framework Comments Bruce Kraemer, Marvell
In order to analyze an operational scenario we would need to have additional information on the number of nodes and their physical relationship. For example, in the DAP example below, how many nodes are there, where are they and what is the characteristic terrain class within which they are located? Framework Observation & Guideline-1 Answer: The method used to compute the number of nodes an area will be based upon area x density. For example, if the area under consideration is 1 square miles and the density is 200 nodes per square mile then there would be 200 nodes in the area. The location will not be “placed” or copied from an actual map. However their locations in the grid space could be calculated using a pair of x-y random number generators. To ensure that all SDO’s analyze the same problem, the node location calculations should be performed exactly once for each scenario and the grided node locations would be fixed and common for all rounds of analysis for all SDOs and technologies. 200 node example generated with random numbers Bruce Kraemer, Marvell
Can it be assumed that all analysis would be based upon single technology deployment. Was there an expectation that a mixed technology deployment be analyzed? Framework Observation & Guideline- 2 Analyses will be performed using a single deployment technology. Slide 24 Bruce Kraemer, Marvell
The analysis of the suitability of a deployment requires a calculation of a link budget. Link budget calculations require using radio performance numbers that are not defined by technology standards documents but are vendor specific. Hence, there may be some differences between individual suppliers’ radio performance numbers. It is proposed that each technology use a single representative set of radio performance numbers. The chosen set of parameters needs to be specified and approved by PAP2. Additionally, the parameter values would be proposed by each SDO and approved by PAP2. E.g. Receive Antenna pattern and gain profile Transmit Antenna pattern and gain profile Receiver sensitivity Transmit power Framework Observation & Guideline- 3 It is proposed that each technology use a single set of radio performance numbers that represent best practice implementations. It is typically true that radio technology offer a range of functional modes. Perhaps the most familiar reason for the modes being the ability to optimize data rate at a given range (which translates to rate at a given link margin). Step 1 would be to agree on the set of parameters within PAP2. Step 2 would involve each SDO proposing the values they would use for the selected parameters. Step 3 would be PAP2 approval of the SDO specific parameter values for each mode of operation to be analyzed. Analyses will be performed using a single set of parameter values for each operational mode. Bruce Kraemer, Marvell
The analysis of deployment performance is presumed to be based upon a point to point relationship between a transmitter receiver pair. No analysis of repeaters or mesh links would be performed. Framework Observation & Guideline- 4 Phase 1 Analysis Analyses performed using a DAP to node model would be denoted as Phase 1 and should be provided by each SDO. However, technologies providing repeater or mesh capabilities would most likely wish to produce Phase 2 analyses based upon these additional capabilties. Note that an additional requirement for meaningful comparison of Phase 2 results will be unambiguous definitions of terms such as “repeater “ and “mesh” as these were not established in Guideline Version 1. Bruce Kraemer, Marvell
The analysis of deployment performance could be based upon only the relationship between a transmitter receiver pair with messages being transferred from one radio MAC to another. Unfortunately this approach would not provide realistic throughput or latency analysis. Realism requires the inclusion of MAC behavior to represent both technology standard features and typical implementations. Framework Observation & Guideline – 5d PHY PHY It is proposed that the PAP2 community needs to review parameters for inclusion. Candidates include: MAC queues, Buffer overflows, Packet loss/retry, transport protocol reliability (e.g. UDPvs http- ACK/retry) , Packet size/fragmentation, media access/collision/backoff/retry, latency, etc. Step 1 would be to agree within PAP2 on the set of behavioral characteristics to be used. Step 2 would involve each SDO proposing the values they would use for the selected parameters.. Analyses will be performed using a single set of parameter values for each operational mode. MAC MAC Bruce Kraemer, Marvell
There is no data traffic volume specified. It is presumed that some portion of the OpenSG requirements would be selected to quantify the representative data traffic to be used for analysis. Please identify the traffic flow. Framework Observation & Guideline- 6 Node quantity and type will be generated as generally described in Guideline #1. The network traffic will be determined by selecting a number of transaction types from the OpenSG Requirements spreadsheet. Bruce Kraemer, Marvell
The initial “Framework Basics” document states: Minimum output: quantity of wireless std/tech/spectrum network gear required by endpoint density category, incremental gear type/count for RF propagation factors & engineering work-arounds for subscribers, and no endpoint coverage conditions Framework Observation & Guideline- 7 Using the analysis guidelines 1-6 the results will show: How many nodes are reachable How many (which?) nodes are actually designated as serviceable and are included in the performance analysis Packet reliability for each serviceable node Data throughput for serviceable node System latency Bruce Kraemer, Marvell
How does the “Framework Basics” document relate to Guideline version 1? Where and How do the deliverables called for fit into the context of Wireless Guidelines version 2? Framework Observation & Guideline- - 8 The analysis results would be added to Wireless Guideline version 1 as a new Chapter. Bruce Kraemer, Marvell
NIST PAP#2 Current Work July 05 - Teleconference 2:00pm ET Agenda & Presentation Detailed Framework Proposal (Cunningham) July 21, Aug 2, Aug 16 - Teleconference 2:00pm ET July 12-14, 2011 - SGIP Summer Meeting, Montreal Canada http://collaborate.nist.gov/twiki-sggrid/pub/SmartGrid/PAP02Wireless/Presentation_07052011.pptx http://collaborate.nist.gov/twiki-sggrid/pub/SmartGrid/PAP02Wireless/Frmwrk-Tool-Dtls-r0.1.xls http://collaborate.nist.gov/twiki-sggrid/bin/view/SmartGrid/PAP02Wireless Bruce Kraemer, Marvell
Update on Modified-Erceg/SUI Path Loss Model May 24, 2011 Prepared by Doug GrayConsultant to WiMAX Forum
Can Modified Erceg/SUI model be considered for lower (700 MHz) and possibly higher (6000 MHz) frequency? • Addresses question from Bill Godwin • Short answer: Yes, it looks reasonable • Link Budget: The next step in wireless range prediction and coverage analysis Outline
BS Antenna: 30 m SS Antenna: 2 m Good agreement between Erceg B & C & Hata Suburban Good agreement between Erceg A & Hata Urban for Path Length > 3.5 km Within 10 dB for Path Length < 3.5 km Large difference between Hata Rural and Erceg Type C Modified Erceg-SUI & Hata-Okumura at 700 MHz • Hata-Okumura Model: • Valid from 150 MHz to 1500 MHz • BS Antenna >30 m (higher than rooftops)
BS Antenna: 25 m SS Antenna: 1.5 m Good agreement between WINNER II (Urban) and Erceg (Type A) Large difference between WINNER Rural and Erceg Type C Modified Erceg-SUI & WINNER II at 6000 MHz • WINNER II Model: • Formulation similar to Hata-Okumura • Valid from 2000 MHz to 6000 MHz • BS Antenna “much” higher than mean building height
System Gain (DL Data Channel, UL Data Channel, & Control Channels) • Technology Specific, Max EIRP may be frequency band-specific • BS & SS/terminal/actor: Tx Power, Antenna Gain, Rx Sensitivity, Smart antenna enhancements, etc • Some SS parameters will vary with application • Account for SG requirements for BER & Minimum Cell-Edge Thruput • Fade Margin • Value selected for desired SG Availability (99.9%, 99.99%, or ??) • Typical values: 8 to 12 dB • Penetration Loss • Necessary for outdoor-to-indoor or indoor-to-outdoor transmission • Varies with frequency, wall material, & number of walls Link Budget: The Next Step for Range & Coverage Analysis
Issues with Existing Simulations • Typical methodology: 3GPP2, 802.16m, ITU-R M.2135, etc. • Technology specific with focus on mobility • SG requirements dominated by fixed terminals • Cluster of 19 base stations with specific BS to BS spacing • Typically close resulting in higher channel capacity • Applicable for specific frequency band 900, 2000 MHz • SG looking for solutions from 700 to 6000 MHz • Generally depend on path loss models assuming high BS antenna height (above roof-top): Hata, Cost231, WINNER II, etc. • Not consistent with SG requirements: Erceg-Modified a better choice • Relatively few active users/terminals per sector/cell: 10 users per sector (30 per BS) is typical • This is not representative of a typical SG deployment (ex: SMs will number in the 1000s)
Some Discussion Materials for July 5, 2011 PAP2 Call Prepared by Doug GrayConsultant to WiMAX Forum
Outline • Items that should be added or expanded in Version 2.0 – Section 5 • Items include: Link budget, & recommended allowances for fading, interference, & bldg penetration loss • Estimating channel capacity – w/o depending on technology-specific simulations • Prioritizing wireless performance features and attributes specifically for SG applications • Section 4: Wireless Capabilities Matrix • Appendix
Link Budget Analysis Can be a large number – big impact on range • System Gain (SysGn): • Technology, vendor-specific – we’ll see a range based on the “standards”, antenna configurations, etc. • Also SG application/usage-specific • Rx Sensitivity related to required BER and cell-edge data rate • Minimum of DL, UL, or Control Channel • Fade Margin (Fm) • Interference Margin (Im) • Penetration Loss (Lp) • Link Budget (LB): LB = SysGn – (FM + Im + LP)
Fading and Fade Margin • Shadow fading – slow or medium-term fading • Primarily due to obstructions • Log-Normal Distribution • May vary with terrain-type: Urban, Suburban, Rural, Indoor, etc • Fast fading • Primarily due to multipath (greater with mobile users) • Rician distributed when dominant signal is present (LoS or Near LoS) • Rayleigh distributed when no dominant signal present (sum of Gaussian variables) • Different fade margins may be necessary for different technologies • Impact of fading mitigated by various technology attributes • 10+ dB may be necessary to achieve desired availability • Significant impact on range and coverage
Chan A Chan A Chan A Chan B Chan A Chan C Interference Margin • Reuse 1 • One channel reused in each sector • Must manage inter-sector interference • Reuse 3 • Each sector has dedicated channel • Requires more spectrum • Interference Margin (Im): • Self-interference and inter-operator interference (in some bands) • Will differ with selected frequency reuse pattern • Impacted by BS to BS spacing (closer spacing – greater potential for self-interference) • May differ with technology • DFS, etc • Typical values ≤ 0.5 dB for Reuse factor of 3 to ≥ 2 dB for a reuse factor of 1
Penetration Loss • Penetration Loss (Lp): • For indoor to outdoor transmission • Will vary with: • Frequency • Wall material, thickness, number of walls, & angle of incidence • ITU-R M.1225 OD to ID Generic Model predicts 11-12 dB at 2000 MHz with Std Dev = 8 dB • NTIA Report 94-206 at 900 MHz
Going Forward • Version 2 should provide a table of suitable or recommended values for: • Fade margins • Interference Margin • Penetration Loss • Question 1: Can we come to a consensus within PAP2 for the above via published reports, papers, field experience, etc.? • I think we can • Question 2: How to fairly estimate channel capacity w/o using technology-specific simulations?
Estimating Channel Capacity:Three Alternatives • Accept estimates from SDOs based on their specific evaluation methodologies • Parameter assumptions not consistent with SG use cases • Results in apples-to-oranges comparisons • Develop a simulation methodology within PAP2 specific to SG to apply to all wireless alternatives • Time-consuming process & may be difficult to reach consensus • Probably beyond the scope of PAP2 - Version 2 • Use a coverage area vs. S/N ratio approach • Assumes uniform distribution of stationary end-user terminals • Assumes all terminals are non-LOS • Requires a table of S/N vs. data rate for each technology
S/N Ratio Increases with Decreased Range • Erceg model predicts 57.85dB per decade at 1800 MHz for Type A terrain with 10m BS antenna height • Value decreases with higher BS antenna height • 3.5 dB S/N at cell edge corresponds to Rx sensitivity for QPSK with ½ coding (1.0 bit/Hz) • -4.3 dB S/N at cell edge corresponds to Rx sensitivity for QPSK with ½ coding & 6 repetitions (0.17 bits/Hz) Range and coverage area is dependent on link budget and required cell-edge data rate
Look-Up TableRequired for each wireless technology • WiMAX Example: • TDD • 10 MHz Channel BW • 1024 sub-carriers • DL/UL Ratio = 1.05 • Permutation = AMC • 768 data sub-carriers • Rates shown in table are net after FEC, pilot, and control carriers 49
Estimating Average Channel Capacity Over Coverage Area • Graph for WiMAX with10 MHz TDD channel, DL:UL ratio = 1.05 & AMC permutation • For a 2.24 Mbps channel UL data rate at cell edge, avg UL channel capacity is 8.53 Mbps • For a 0.37 Mbps channel UL data rate at cell edge, avg UL channel capacity is 4.66 Mbps • 45% increased range but lower channel capacity • UL Channel capacity is the “area” under the curve – (I used area increments of 10%) • Result takes account Terrain Type and BS antenna height • The range and coverage area are dependent of link budget and frequency