Download
1 / 23
240 likes | 423 Views
Locating Variance: Post-Hoc Tests. Developing Study Skills and Research Methods (HL20107). Dr James Betts. It is easy (i.e. data in P value out) It provides the ‘Illusion of Scientific Objectivity’ Everybody else does it. Why do we use Hypothesis Testing?.

E N D
Locating Variance: Post-Hoc Tests Developing Study Skills and Research Methods (HL20107) Dr James Betts
It is easy (i.e. data in P value out) It provides the ‘Illusion of Scientific Objectivity’ Everybody else does it. Why do we use Hypothesis Testing?
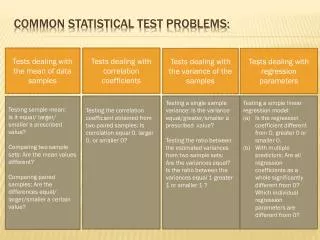
P<0.05 is an arbitrary probability (P<0.06?) The size of the effect is not expressed The variability of this effect is not expressed Overall, hypothesis testing ignores ‘judgement’. Problems with Hypothesis Testing?
Lecture Outline: • Influence of multiple comparisons on P • Tukey’s HSD test • Bonferroni Corrections • Ryan-Holm-Bonferroni Adjustments.
Placebo Placebo Lucozade Lucozade Gatorade Gatorade Powerade Powerade
Placebo Placebo Lucozade Lucozade Gatorade Gatorade Powerade Powerade
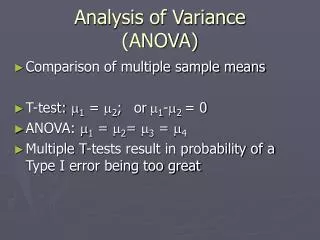
i.e. Placebo vs Lucozade Placebo vs Gatorade Placebo vs Powerade Lucozade vs Gatorade Lucozade vs Powerade Gatorade vs Powerade We accept ‘significance’ and reject the null hypothesis at P0.05 (i.e. a 5% chance that we are wrong) Performing multiple tests therefore means that our overall chance of committing a type I error is >5%. Why not multiple t-tests?
Post-hoc Tests • A popular solution is the Tukey HSD (Honestly Significant Difference) test • This uses the omnibus error term from the ANOVA to determine which means are significantly different • T = (q) Error Variance √ n
Tukey Test Critique • As you learnt last week, the omnibus error term is not reflective of all contrasts if sphericity is violated Placebo Lucozade • So Tukey tests commit many type I errors with even a slight degree of asphericity. Gatorade Powerade
Solution for Aspherical Data • There are alternatives to the Tukey HSD test which use specific error terms for each contrast • Fisher’s LSD (Least Significant Difference) • Sidak • Bonferroni • Many others… • e.g. Newman-Kewls, Scheffe, Duncan, Dunnett, Gabriel, R-E-G-W, etc.
Trial 2 Trial 4 Trial 1 Fisher’s LSD Bonferroni Trial 3
Bonferroni Correction Critique • Correction of LSD values successfully controls for type I errors following a 1-way ANOVA • However, factorial designs often involve a larger number of contrasts, many of which may not be relevant. Recovery Supp. 1 Recovery Supp. 2 See also Perneger (1998) BMJ 316: 1236
Solution for Factorial Designs • An adjustment to the standard Bonferroni correction can be applied for factorial designs • This ‘Ryan-Holm-Bonferroni’ or ‘stepwise’ method involves returning to the P values of interest from our LSD test • These P values are placed in numerical order and the most significant is Bonferroni corrected (i.e. P x m) • However, all subsequent P values are multplied by m minus the number of contrasts already corrected.
A Tukey test may be appropriate when sphericity can be assumed Multiple t-tests with a Bonferroni correction are more appropriate for aspherical data Stepwise correction of standard Bonferroni procedures maintain power with factorial designs Best option is to keep your study simple: Pre-planned contrast at a specific time point Summary statistics (e.g. rate of change, area under curve) Just make an informed based on the data available. Summary Post-Hoc Tests
Further reading from this lecture… • Atkinson, G. (2001) Analysis of repeated measurements in physical therapy research Physical Therapy in Sport 2: p. 194-208 • Atkinson, G. (2002) Analysis of repeated measurements in physical therapy research: multiple comparisons amongst level means and multi-factorial designs Physical Therapy in Sport 3: p. 191-203
Compulsory reading for next week’s lecture… • Batterham A. M. & Atkinson, G. (2005) How Big Does My Sample Need to Be? A primer on the Murky World of Sample Size Estimation Physical Therapy in Sport 6: p. 153-163.