Download
1 / 25
250 likes | 342 Views
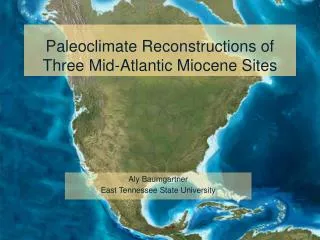
CCSM PaleoClimate Working Group Transient Mid-Holocene Simulation. Caspar Ammann Bette Otto-Bliesner Esther Brady Carrie Morrill Fortunat Joos Raimond Mueschler Sam Levis Bob Tomas Noah Diffenbaugh Zhengyu Liu Matthew Huber Bruce Briegleb

E N D
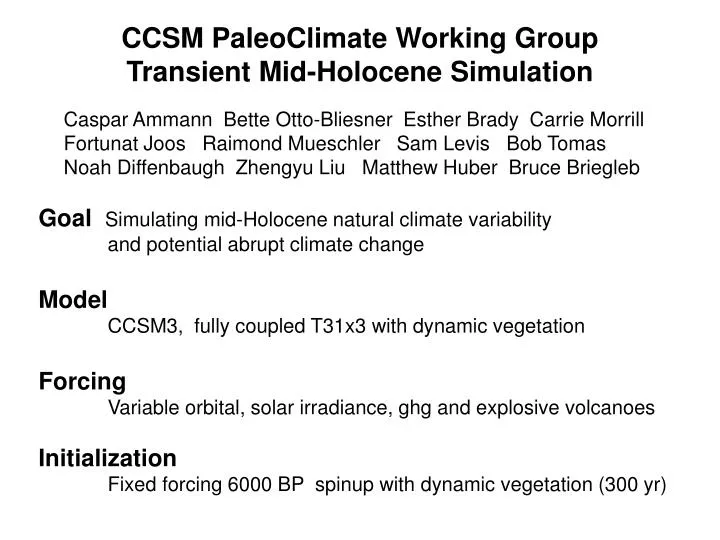
CCSM PaleoClimate Working Group Transient Mid-Holocene Simulation Caspar Ammann Bette Otto-Bliesner Esther Brady Carrie Morrill Fortunat Joos Raimond Mueschler Sam Levis Bob Tomas Noah Diffenbaugh Zhengyu Liu Matthew Huber Bruce Briegleb Goal Simulating mid-Holocene natural climate variability and potential abrupt climate change Model CCSM3, fully coupled T31x3 with dynamic vegetation Forcing Variable orbital, solar irradiance, ghg and explosive volcanoes Initialization Fixed forcing 6000 BP spinup with dynamic vegetation (300 yr)
Years 65-84 (~ 5920 BP) Compared to Pre-Industrial +4.5 Wm-2North Pole -1.0 Wm-2Equator Years 1580-1599 (~ 4410 BP) Compared to Pre-Industrial +3.6 Wm-2 North Pole -0.8 Wm-2 Equator
6000 BP 4350 BP Transient Mid-Holocene Temperature Trends Global Mean Surface Temperature Ocean Mean Temperature
Years 65-84 (~5920 BP) Years 1580-1599 (~4410 BP) JJA Ts Difference with PI JJA Precipitation Difference with PI
North African Grasses and Boreal Forests have small downward trends in percent concentrations North African Monsoon, 10 to 30 latitude Boreal, 50 to 90 latitude 6000 BP 4200 BP 6000 BP 4200 BP
JAS years 950-1050 (~5000 BP) minus 150-250 (~5800 BP) Precip (color, 0.2 mm/day) SLP (contours, 0.2 mb) 1000 mb Wind (vectors, 1 m/sec reference) mm / day
300 600 900 1200 1500 Years 5900 BP 4400 BP
Transient Mid-Holocene Pre-Industrial Dynamic Vegetation 6000 BP Present
Transient Mid-Holocene Simulation Preliminary Results after 1650 years Global cooling -0.38 C Stabilization of ocean temperature Southward shift in African-Asian monsoons Some southward shift in boreal forests and North African grasses Current Plan Run forward to present day At ~10 yrs / day, might finish late summer 2007 Encourage Analysis Some interesting features noticed already Will any abrupt changes occur? Stay tuned Selected data analysis available online at: http://www.ccsm.ucar.edu/working_groups/Paleo/experiments/b30.108.html Data available on NCAR Mass Store /CCSM/paleo/b30.108
Transient Holocene Simulation Players Carrie Morrill, Caspar Ammann, Bette Otto-Bliesner, Fortunat Joos, Raimond Mueschler, Sam Levis, Bob Tomas, Noah Diffenbaugh, Zhengyu Liu, Matthew Huber, Bruce Briegleb Vision Many paleoclimate proxy records show abrupt shifts in the mid-Holocene. The Transient Holocene simulation allows us to address: (1) Are there any abrupt changes simulated by CCSM3 (either regional, hemispheric or global)? (2) If yes, how are these transitions similar/different from those observed in paleoclimate records (i.e. location, speed, direction of climate change)? (3) If no, what are the limitations of the model and its forcings? What else might need to be changed for abrupt changes to occur? Model CCSM3, T31 x 3 Includes dynamic vegetation Initialized from 6 kyr ago spinup with dynamic vegetation, 300 years long
Transient Holocene Simulation (cont) Forcings Orbital: Parameters updated every four years. Solar: Solar constant from fit to solar modulation estimated from 14C/10Be ice core data, using satellite observations at end of record. Peak to peak range 0.12% of mean; minimal trends. GHG: CO2, CH4 and N2O using smooth fits to ice core data. Volcanic: Statistical occurance from 4050 BC to 850 AD, historical after 850 AD. Maximum monthly tropical volcanic mass equals Tambora 1815; maximum extratropical equals Laki 1783. History Files Monthly means: cam, pop, clm, csim. Daily means: T,u,v @ 850, 300 hPa, sea level pressure; surface temperature and precipitation.
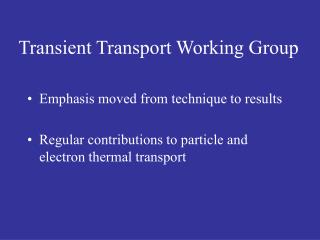
Transient Holocene Simulation (cont) Current Status Out 800+ years (i.e. from 4050 BC to 3250 BC) Progressing approximately 10 years / day Preliminary Results Noticeable short term impact of volcanoes. Slight global cooling trend (-0.1 to -0.2 C) Southward shift in subtropical Monsoon and vegetation associated with regional cooling, presumably due to changes in orbital forcing. Noticeable modulation of C3 grasses in African Monsoon, presumably due to drought cycles. Southward shift in boreal forests, also presumably due to changes in orbital forcing.
Years 65-84 Orbital forcing has small changes over several hundred years Years 680-699
Greenhouse gases have small and very smooth changes
Summary of Forcings Orbital ~ 0.5 W m-2 / century mid to high latitudes; long term secular trend Solar ~ 0.29 W m-2 peak-to-peak over ~2 centuries; no secular trend GHG ~ +0.0067 W m-2 / century CO2, 4050 BC to ~1000 AD ~ +0.0016 W m-2 / century CH4, 4050 BC to ~ 1500 AD ~ +0.0006 W m-2 / century N2O, 4050 BC to ~ 1000 BC Volcanic 0 down to -10 W m-2, but short lived (a few years). Estimated long term (i.e. several hundred years) mean forcing ~ -0.3 W m-2
Top of model fluxes show volcanic forcings Global surface temperature shows small cooling trend High northern latitude snow depth shows slight upward trend
Years 680-699 Years 65-84 JJA Solar Insolation JJA Ts
Years 65-84 Years 680-699 JJA Ts JJA Precipitation
African Grasses and Boreal Forests have small downward trends in concentrations African Monsoon, 10 to 30 latitude Boreal, 50 to 90 latitude
Transient Holocene Simulation Preliminary Results Noticeable short term impact of volcanoes. Slight global cooling trend (-0.1 to -0.2 C) Southward shift in subtropical Monsoon and vegetation associated with regional cooling, presumably due to changes in orbital forcing. Noticeable modulation of C3 grasses in African Monsoon, presumably due to drought cycles. Southward shift in boreal forests, also presumably due to changes in orbital forcing.
Transient Holocene Simulation Current Plan Run out 2400 years, or from 4050 BC to 1650 BC At approximately 10 years / day, should finish August 2006 Encourage Analysis Some interesting features noticed already Will any abrupt changes occur? Stay tuned Selected data analysis available online at: http://www.ccsm.ucar.edu/working_groups/Paleo/experiments/b30.108.html and updated every few days Data available on NCAR Mass Store /CCSM/paleo/b30.108 Monthly and selected daily data available Future? Forcing files continuous up to 2000 AD