Download
1 / 61
610 likes | 690 Views
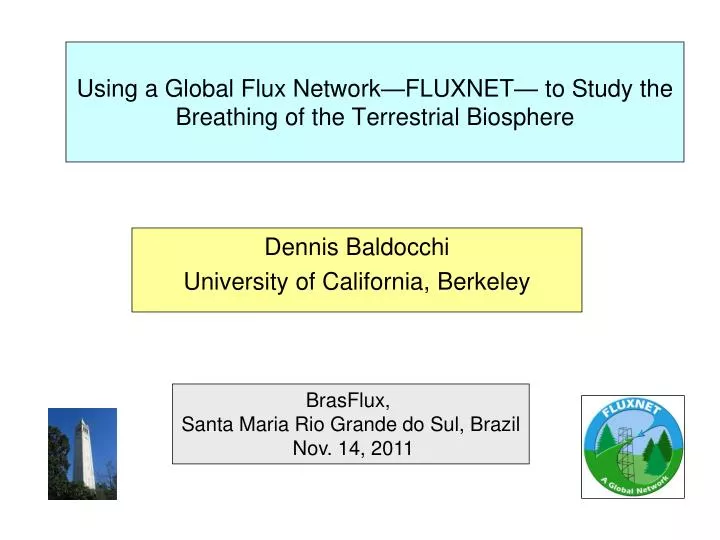
Using a Global Flux Network—FLUXNET— to Study the Breathing of the Terrestrial Biosphere. Dennis Baldocchi University of California, Berkeley. BrasFlux , Santa Maria Rio Grande do Sul , Brazil Nov. 14, 2011. Contemporary CO 2 Record.

E N D
Using a Global Flux Network—FLUXNET— to Study the Breathing of the Terrestrial Biosphere Dennis Baldocchi University of California, Berkeley BrasFlux, Santa Maria Rio Grande do Sul, Brazil Nov. 14, 2011
Methods To Assess Terrestrial Carbon Fluxes at Landscape to Continental Scales, and Across Multiple Time Scales GCM Inversion Modeling Eddy Flux Measurements/ FLUXNET Remote Sensing/ MODIS Forest/Biomass Inventories Physiological Measurements/ Manipulation Expts. Biogeochemical/ Ecosystem Dynamics Modeling
Developing a System that is Everywhere, All of the Time century Landsurface remote sensing decade Eddycovariancetowers talltowerobser- vatories remote sensingof CO2 year Temporal scale month week day hour local 0.1 1 10 100 1000 10 000 global plot/site Continent Spatial scale [km] Credit: Markus Reichstein, MPI
FLUXNET Status of Global Network, 500+ Sites
FLUXNET Represents Many Climate Spaces, Well More Data and Sites in Tropical Rain Forests are Welcome!
Growth in Africa, Australia and Asia, Sustenance in Brazil and Europe Decline in Canada and US Voids in India and Latin America
Many Towers are Not Active, nor Submitting data, circa La Thuile dataset
Fluxdata.org – A Common, Shared Database Flux/Met Data Regional Networks BADM Data BADM Data + Flux/Met Gap-Filled/QA/Products Flux/Met Data Individual Sites www.Fluxdata.org
Data processing, Value Added Products and Uncertainty Estimation Half hourly data u* threshold selection - 3/5 different methods 3 methods, bootstraping… Also daytime, also data after low turb., … u* filtering - 3/4 possibility MDS and ANN Gapfilling - 2 methods Partitioning - 3 methods Reichstein, Lasslop, van Gorsel
Community Building/OutReach Shared Database: www.fluxdata.org Newsletter: FluxLetter Young Scientist Forums International Workshops Marconi, 2000 Orvieto, 2002 Lake Tahoe, 2003 Firenze, 2004 La Thuile, 2007 Asilomar, 2009 Berkeley, 2011
Challenges/Opportunities for Future • To Sustain and Grow the Network that Asks and Answers Network-Scale Questions • To sample representative Climates and Biomes • To sample representative Disturbance Classes • Detect trends in Fluxes as Climate and Land Use Changes • Validate and Parameterize New Generation of Land Surface-Atmosphere Exchange Models • Serve as Critical Partner in Machine Learning Approaches to Flux Upscaling with Satellite Remote Sensing • Provide Ground Truth for MODIS Land Products • Provide Ground Truth for Sources/Sinks produced by global CO2 networks and next generation CO2 Satellite Sensors
Big Network Issues Facing Flux Networks in 2011 • How can we Sustain the Network? • How many Stations are Enough? • Where do we need new Stations? • How can we encourage Scientists to Participate, Submit Data and Open the Data to the Wider Science Community, with Benefits to ALL?
Data Sharing is a Win/Win Activity • Get Access to Data from other Sites and Networks • Learn more about your site though Comparisons • Can Initiate, Lead or Participate on multi-site synthesis activities • Data Sharing Rules Come from the Community via Bottom-Up Process • Multiple Levels of Data Availability are Provided • Proposed Projects are Vetted to Protect PIs and Reduce Duplication • Future of Biogeosciences and Flux Research
Charge/Recommendations for BrasFlux • Roving Network Calibration System • Expand Suite of Sensors • Digital Camera for Phenology and LAI • Diffuse Radiation • 4 Band Net Radiometers and High Quality Quantum Sensor • Database, with Vetted Processing Algorithms, Qa/Qc, Comprehensive Site Documentation and Version Control
What Have We Learned? • Time • Annual Integration • Seasonal Dynamics • Inter-Annual Variability • Disturbance/Chronosequence • Processes • Photosynthesis = f(Q,T,functional type) • Respiration = f(T, growth, ppt, q) • Space • Other Uses and Application • Ecosystem Modeling
Probability Distribution of Published NEE Measurements, Integrated Annually
Does Net Ecosystem Carbon Exchange Scale with Photosynthesis? Ecosystems with greatest GPP don’t necessarily experience greatest NEE Baldocchi, Austral J Botany, 2008
Ecosystem Respiration Scales Tightly with Ecosystem Photosynthesis, But Is with Offset by Disturbance Baldocchi, Austral J Botany, 2008
Are Large Carbon Fluxes Defensible? GPP at 2% efficiency and 365 day Growing Season tropics GPP at 2% efficiency and 182.5 day Growing Season FLUXNET 2007 Database
Net Ecosystem Carbon Exchange Scales with Length of Growing Season Baldocchi, Austral J Botany, 2008
Decadal Plus Time Series of NEE:Flux version of the Keeling’s Mauna Loa Graph Data of Wofsy, Munger, Goulden, et al.
Interannual Variation and Long Term Trends in Net Ecosystem Carbon Exchange (FN), Photosynthesis (FA) and Respiration (FR) Urbanski et al 2007 JGR
Interannual Variations in Photosynthesis and Respiration are Coupled Baldocchi, Austral J Botany, 2008
Perturbations in Fluxes following 2003 European Heat Spell/Drought Implications on Drying of the Amazon
How many Towers are needed to estimate mean NEE, GPP and assess Interannual Variability, at the Global Scale? We Need about 75 towers to produce Robust and Invariant Statistics Based on Current Population
Increasing the Size of the Network Reduces the Sampling Error, but in an Asymptotic Manner Limit in the Precision of NEE Change that can be detected if Upscaled Globally: +/- 20 gC m-2 y-1 ~ 2 PgC/y = 2 1015gC/y Can We Truly Detect Year-Year Variations in Fluxes with a Sparse Network? Errors that sound Small at one scale may be Huge at another.. Says Nothing about Biases by Under Sampling Dominant Regions like the Tropics
Interannual Variability in NEE is tiny across the Global Network
What is Interannual Variability of Fluxes, sampled with the Network and the Network Detection Limit?
This Analysis Would Suggest Global Metabolism is Invariant with Time, like the Solar Constant Assuming Global Arable Land area is 110 106 km2, Mean Global GPP ranges between 121.3 and 127.8 PgC/y Precision is about +/- 7 PgC/y
Complicating Dynamical Factors • Switches • Phenology • Drought • Frost/Freeze • Pulses • Rain • Litterfall • Emergent Processes • Diffuse Light/LUE • Acclimation • Lags • Stand Age/Disturbance
Emergent Scale Process:CO2 Flux and Diffuse Radiation • We are poised to see effects of Cleaner/Dirtier Skies and Next Volcano Niyogi et al., GRL 2004
Optimal NEE: Acclimation with Temperature E. Falge et al 2002 AgForMet; Baldocchi et al 2001 BAMS
Soil Temperature: An Objective Indicator of Phenology?? Data of Pilegaard et al.
Soil Temperature: An Objective Measure of Phenology, part 2 Baldocchi et al. Int J. Biomet, 2005
Rain-Induced Respiration Pulses Xu et al. 2005 GBC
Spatial Variations in C Fluxes Xiao et al. 2008, AgForMet
Upscale NEP, Globally, Explicitly • Compute GPP = f(T, ppt) • Compute Reco = f(GPP, Disturbance) • Compute NEP = GPP-Reco Leith-Reichstein Model FLUXNET Synthesis Baldocchi, 2008, Aust J Botany Reco = 101 + 0.7468 * GPP Reco, disturbed= 434.99 + 0.922 * GPP
Pros and Cons of Extracting Global Information from a Sparse Network
FLUXNET Over represents GPP in Temperate, Mid-Productive Ecosystems; Under-represents GPP in Semi-Arid, low-productive and Tropical, High Productive Regions
Do Snap-Shot C Fluxes, inferred from Remote Sensing, Relate to Daily C Flux Integrals? Sims et al 2005 AgForMet
Global GPP 121 +/- 8 PgC/y Beer et al. 2010 Science
Joint pdf GPP, Solar Radiation and Temperature E[GPP]= 1237 gC m-2 y-1~136 PgC/y
Importance, and Uncertainty, of Tropical GPP Beer et al. 2010 Science
Regional Maps for Carbon Markets Disturbances Climate Anomalies
Evaluation of upscaled global Evapotranspiration • Map of mean Evapotranspiration from 1982-2008 • Predicted vs. Observed ET at FLUXNET sites (10-fold cross-validation from MTE training) • Corroboration aganist river catchment water balances • Comparison against GSWP-2 land surface model ensemble (16 models) stratified according to bioclimatic zones Jung et al. 2010 Nature
Spatialize Phenology with Transformation Using Climate Map Baldocchi, White, Schwartz, unpublished
Limits to Landscape Classification by Functional Type • Stand Age/Disturbance • Biodiversity • Fire • Logging • Insects/Pathogens • Management/Plantations • Kyoto Forests