Download
1 / 24
680 likes | 1.55k Views
Inventory Optimization. Inventory Optimization. The case for inventory optimization Reduce stock holding 15% to 20% Service levels which match the company’s capacity to deliver Manufacturing stability and improved plant utilization Recognition as a reliable supplier Increased turnover

E N D
Inventory Optimization The case for inventory optimization Reduce stock holding 15% to 20% Service levels which match the company’s capacity to deliver Manufacturing stability and improved plant utilization Recognition as a reliable supplier Increased turnover Improved working capital 6% to 10% improvement on ROE Optimal use of scarce resources
Benefits of Optimization Reduced Risk Profile Improved Service Levels Streamlined Product Range More Working Capital Improved Market Perception Better Supplier Management Improved Factory Utilization Optimal Warehouse Utilization Greater Flexibility
Forecast Inventory Optimization Lead Time The Inventory Problem Level of Inventory Footprint of Uncertainty Time
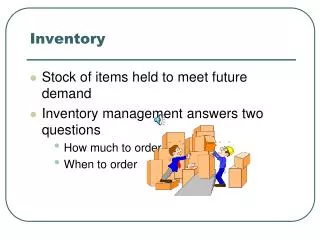
Inventory Risk Primary Risk Forecast Accuracy Lead Time Variability Secondary Risk Cycle Stock Batch or Lot size, EBQ, MOQ Shipping constraints (time, mass or volume) Lead Time Review frequency Data inaccuracies Poor Management
Maximum Minimum Elements of Inventory Excess stock Result of poor forecasts, policy settings or management Cycle stock (Order frequency) Determined by batch size, EBQ, MOQ, or shipping constraints Level of Inventory Safety or buffer stock Set to cover the risk to find a balance between service and investment Time
Inventory Optimization Suite Forecasting Pareto Analysis, batch and manual forecasting, forecast accuracy, simple work flow Forecasting Families & Groupings Pareto and forecasting at higher levels, aggregation and disaggregation of forecasts Families & Groupings Inventory Optimization Track Lead Times, set policy, order & distribution planning, inventory modeling Inventory Optimization
Service Efficiency Service Efficiency Service Efficiency Service Efficiency Retail Store Distribution Centre Factory Raw Material Supplier Lead Time Lead Time Lead Time Inventory Inventory Inventory Inventory The Supply Chain Predominant Flow of information Predominant Flow of materials and goods
Planning Module MPS, MRP Sales Orders Invoiced Sales Forecasting Module Forecasting Module Adjustments to History Forecast History Pareto Analysis Manual Forecast Batch Forecast Demand Adjustments Forecast Approval Current Forecast
Families and Groupings Objective is to logically group Stock items Analyze Inventory Movement (Pareto), Generate Forecasts and monitor Inventory Holding and Turns at levels above SKU (Stock Keeping Unit) Categorize stock into Active, Excess, Slow Moving or Static at each of the levels Groupings set in F&G used to set policy
Families and Groupings Porsche Family Volkswagen Family Volkswagen Porsche Filters Filters Brakes Group Brakes Brakes Clutch & Gearbox Clutch & Gearbox Body Parts Body Parts
Aggregate in Hecto Litres Families and Groupings Aggregate in Units or Thousands Brand Orange Brand Apple Pack Size Orange 500ml Orange 300ml Apple 1litre Orange 1litre Apple 500ml Apple 300ml Consolidated Warehouse East Warehouse South Warehouse North Warehouse East Warehouse
Inventory Optimization Inventory Optimization is the Focal Point for Forecasting and families & Groupings Define parameters to balance investment & service Key elements that drive inventory are coordinated, tracked and controlled to optimize inventory Primary output of IO is time phased safety stock to drive the replenishment through MRP
Optimization Work Flow Forecast process Approve & write to RP Database Families and Groupings Requirements Planning Policy and Setup Order Actions Process Supplier Evaluation Run Optimization Distribution SCT Actions Check Variances and Targets MRP No Yes OK?
Lead Time Tracking Accurate tracking of actual lead times Different delivery methods tracked Lead time variances monitored Input to Supplier evaluation Input to risk assessment Used in calculation of the safety stock Used in distribution pull calculations
Supplier Scorecards Evaluation of contribution to turnover and profit Evaluation of delivery performance Evaluation of their relative performance to other suppliers Evaluation of their importance to the business Evaluation of their relative supply chain efficiency
Inventory Policy Policy settings drive the target inventory Set by groupings defined in F&G Defines frequency of ordering Defines stock cover in SCT supplied warehouses Sets target service levels Feeds safety stock calculation Used by MRP to establish quantities to order based on time phased safety stock
Distribution Planning Supply chain rules set up between internal warehouses Rules set for the distribution of stock between warehouses Will drive both replenishment and re-distribution of excess De-coupled supply chain with pull logic
Order Planning Plan the order cycles based on planned order frequency, MOQs and supplier constraints (like time, mass or volume requirements) Set up order calendar allocating all items by warehouse in accordance with planned cycles Checks for ‘new’ or re-distribution Can auto-order on internal supplier
Order Work Flow Families & Groupings Process Forecast Process Order Cycle Setup Distribution Setup Optimization Process/MRP Order Action Report Order Review
Safety Stock vs Service Level 100 % 3 % 95 % 10 % 90 % Service Level 85 % 80 % 75 % 70 % 6 weeks 2 weeks 4 weeks Investment
Effects of Policy Changes Level of Inventory Level of Inventory Level of Inventory Time Time Time Cycle Stock 2 weeks Target service 98% Safety Stock 5 weeks Average stock 6 weeks Cycle Stock 2 weeks Target service 95% Safety Stock 4 weeks Average stock 5 weeks Cycle Stock 4 weeks Target service 95% Safety Stock 4 weeks Average stock 6 weeks