Download
1 / 9
90 likes | 233 Views
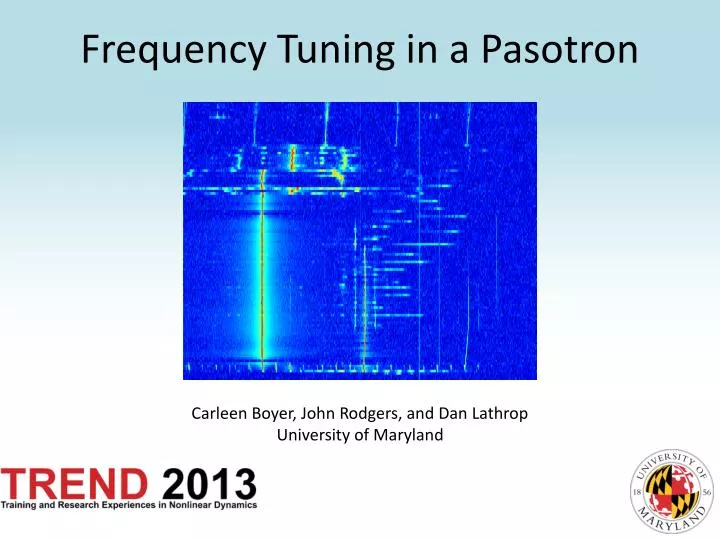
Frequency Tuning in a Pasotron. Carleen Boyer, John Rodgers, and Dan Lathrop University of Maryland. Motivation: IEDs and Microwaves?. Microwaves can be used to safely detonate or defeat IEDs. HOWEVER. Wikipedia Commons. Current systems of generating microwaves exhibit two major issues:

E N D
Frequency Tuning in a Pasotron Carleen Boyer, John Rodgers, and Dan Lathrop University of Maryland
Motivation: IEDs and Microwaves? • Microwaves can be used to safely detonate or defeat IEDs HOWEVER Wikipedia Commons • Current systems of generating microwaves exhibit two major issues: • Systems are not powerful enough • Frequency output is difficult to control
Experimental Pasotron System Missing Frequencies! 250 Time (μs) 150 50 1.15 1.45 1 1.3 Frequency (GHz) J.C. Rodgers • Plasma generated from heating helium gas • Grid creates a voltage potential, accelerating electrons • Electron beam couples with the field of the helix
Tuning the Pasotron 4 • Frequency plot of the resonances in the Pasotron • Shows the spectrum of frequencies in the tuned Pasotron Log(|Z|) (Ohms) 0 -4 1.05 1.15 1.25 1.35 De-Q these points Frequency (GHz) 6000 • Q-factor shows which resonances will be excited in device • Wanted to shift frequency range 4000 Q-factor 2000 1.05 1.15 1.25 1.35 Frequency (GHz)
Hot Testing: Low Current UNTUNED TUNED 250 250 Time (μs) Time (μs) 150 150 50 50 1.15 1.45 1 1.3 1.15 1.45 1 1.3 Frequency (GHz) Frequency (GHz) Relatively low current of around 30 A shows the excitable frequencies of the system
Hot Testing: Mid Current UNTUNED TUNED v v 250 250 150 150 Time (μs) Time (μs) v v 50 50 1.15 1.45 1.15 1.45 1 1.3 1 1.3 v Frequency (GHz) Frequency (GHz) Mid-range current of around 110 A shows frequency spread in the untuned system, and smaller excited band in the tuned system.
Hot Testing: High Current UNTUNED TUNED v v 250 250 150 150 Time (μs) Time (μs) v v 50 50 1.15 1.45 1.15 1.45 1 1.3 1 1.3 v Frequency (GHz) Frequency (GHz) High current of around 170 A results in chaotic excitation of the frequencies, and the phenomena of mode hopping.
Conclusions • Wanted high spectral density and wide bandwidth • Adjusted the cold Q-factors and showed that hot operation was affected by these adjustments • Increased spectral density • Eliminated mode competition, allowed for mode hopping operation
Acknowledgments • Advisers Dan Lathrop and John Rodgers • Special thanks to Dave Meichle and FrejaNordseik • NSF Award Number PHY1156454 • Y.R. Bliokh, G.S. Nusinovich, J.C. Rodgers, et al., “Ion noise in the plasma-assisted slow wave osillator”, IEEE Trans. Electronic Devices, vol. 52, pp.845-857, 2005. • G.S. Nusinovich, O.V. Sinitsyn, J.C. Rodgers, A.G. Shkvarunets, Y. Carmel, “Phase locking in backward-wave oscillators with strong end reflections”, Physics of Plasmas, vol. 14, 2007.