Download
1 / 35
380 likes | 715 Views
Ecological Resources and Environmental Problems. What do we need to survive?. Water Food Energy Shelter Clean air Etc. These are resources – anything with potential in creating wealth or giving satisfaction What are natural resources and services?.

E N D
What do we need to survive? • Water • Food • Energy • Shelter • Clean air • Etc. • These are resources – anything with potential in creating wealth or giving satisfaction • What are natural resources and services?
Renewable, non-renewable, and potentially renewable resources • Non-renewable (exhaustible) = exists in a fixed amount and cannot be renewed as fast as it is used up • Examples? • Supply can be extended • More efficient use • Recycling/Reusing • Substituting materials
Renewable, non-renewable, and potentially renewable resources • Perpetual = supply is continuous and will not run out • Example? • Renewable = can use without diminishing future availability • Potentially renewable = can replenish itself within days to several 100 years • Sustainable yield = highest rate they can be used without reducing available supply • Examples? • Misuse can make them more limited than nonrenewable resources
….. and Some Are Not Nonrenewable resources • Energy resources • Metallic mineral resources • Nonmetallic mineral resources
4 R’s of Resource Management • Reduce • Reuse • Recycle • Refuse (don’t use) • (Rethink)
Reuse Fig. 1-7, p. 11
Recycle Fig. 1-8, p. 12
Countries Differ in Levels of Unsustainability • Economic growth: increase in output of a nation’s goods and services HOW IS IT MEASURED? • Gross domestic product (GDP): annual market value of all goods and services produced by all businesses, foreign and domestic, operating within a country CHANGES IN COUNTRY’S GROWTH PER PERSON • Per capita GDP: one measure of economic development
Countries Differ in Levels of Unsustainability (2) • Economic development: using economic growth to raise living standards • More-developed countries (MDC): North America, Australia, New Zealand, Japan, most of Europe • Less-developed countries (LDC): most countries in Africa, Asia, Latin America
Countries by Gross National Income per Capita Supplement 8, Fig 2
1-2 How Are Our Ecological Footprints Affecting the Earth? • Concept 1-2 As our ecological footprints grow, we are depleting and degrading more of the earth’s natural capital.
Keys to Sustainability – Understanding our Footprint • Your ecological footprint • Measurement of the amount of land and water needed to provide you with the resources you use and to absorb and recycle waste and pollution produced by that use • Calculate your ecological footprint tonight
We Are Living Unsustainably • Environmental degradation: wasting, depleting, and degrading the earth’s natural capital • Happening at an accelerating rate • Also called natural capital degradation
Natural Capital Degradation Fig. 1-9, p. 13
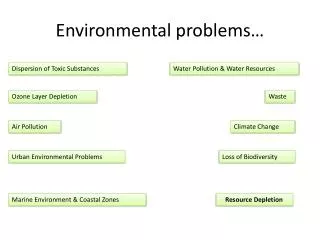
Pollution: Sources and Types Sources of pollution • Point sources • E.g., smokestack • Nonpoint sources • E.g., pesticides blown into the air Main type of pollutants • Biodegradable • break down over time • Nondegradable • can’t be broken down • Unwanted effects of pollution
Point-Source Air Pollution Fig. 1-10, p. 14
Nonpoint Source Water Pollution Fig. 1-11, p. 14
UNwanted Effects of Pollution • disrupt/degrade life support system for animals • damage wildlife, human health and property • create nuisances, e.g. noise, unpleasant smells, tastes, sights
SOLUTIONS:How do we control pollution? Pollution cleanup (output pollution control) • cleaning up or diluting pollutants after we have produced them Pollution prevention (input pollution control) • reduces or eliminates the production of pollutants What is the best solution? What are the problems?
Overexploiting Shared Renewable Resources: Tragedy of the Commons • Three types of property or resource rights • Private property • Common property • Open access renewable resources • Tragedy of the commons • Common property and open-access renewable resources degraded from overuse • Solutions
The Tragedy of the CommonsOr: the challenge of common-pool resourcesOr: why the sum total of individual “rational” choices can lead to perverse (and socially sub-optimal) outcomes Credits: cow images from http://www.woodyjackson.com/
Imagine a field of grass shared by 6 farmers, each with one cow…
A few facts: Each cow currently produces 20 liters of milk per day The carrying capacity of the commons is 8 cows. For each cow above 8, the milk production declines by 2 liters (due to overgrazing, there is less grass for each cow: less grass, less milk!). 20 liters 20 liters 20 liters 20 liters 20 liters 20 liters Total daily milk production for the commons: 120 liters
Do the farmers sit back and stay at 6 cows? Not if they are individual profit maximizers (here simplified as milk production maximizers) 20 liters 20 liters 20 liters 20 liters 20 liters 20 liters Total daily milk production for the commons: 120 liters (6 cows)
Do the farmers sit back and stay at 6 cows? Not if they are individual profit maximizers (here simplified as milk production maximizers) “I’ll get another cow” 40 liters 20 liters 20 liters 20 liters 20 liters 20 liters Total daily milk production for the commons: 140 liters (7 cows)
We are now at the carrying capacity -- do they stop? No. “Then I’ll get another cow too” 40 liters 40 liters 20 liters 20 liters 20 liters 20 liters Total daily milk production for the commons: 160 liters (8 cows)
They are now at the maximum total milk production. But do they stop? No… 36 liters 36 liters “I’ll get another cow” 18 liters 36 liters 18 liters 18 liters Total daily milk production for the commons: 162 liters (9 cows)
32 liters 32 liters 16 liters 32 liters 16 liters “My cow is now less productive, but 2 will improve my situation” 32 liters Total daily milk production for the commons: 160 liters (10 cows)
28 liters 28 liters 14 liters 28 liters “I’ll get another cow” 28 liters 28 liters Total daily milk production for the commons: 154 liters (11 cows)
“Well, everyone else is getting one, so me too!” 24 liters 24 liters 24 liters 24 liters 24 liters 24 liters Total daily milk production for the commons: 144 liters (12 cows)
“Well, I can still increase milk production if I get a third cow” 30 liters 20 liters 20 liters 20 liters 20 liters 20 liters Total daily milk production for the commons: 130 liters (10 cows)