Download
1 / 45
450 likes | 536 Views
A Contrast of Two Las Vegas Flash Flood Scenarios. Introduction/Background A Classic Monsoon Case July 8, 1999 A Transition Flow Case August 10, 1997. The Monsoon Season in Las Vegas. 2.59” (8/21/57) 1.75” (8/10/42) 1.56” (8/12/79) 1.36” (7/28/84) 1.34” (8/17/77) 1.32” (7/24/56)

E N D
A Contrast of Two Las VegasFlash Flood Scenarios • Introduction/Background • A Classic Monsoon Case • July 8, 1999 • A Transition Flow Case • August 10, 1997
2.59” (8/21/57) 1.75” (8/10/42) 1.56” (8/12/79) 1.36” (7/28/84) 1.34” (8/17/77) 1.32” (7/24/56) 1.29” (7/24/55) 1.25” (7/26/76) 3.55” (7/3/01) Searchlight Pass 3.19” (7/8/99) Blue Diamond Ridge 3.13” (8/10/97) Boulder City 2.24” (9/11/98) Meadow Valley Wash 2.05” (7/19/98) Flamingo Wash Exceptional Storm Totals At McCarran: Within Clark County:
Southern Nevada Thunderstorm Days(average morning sounding parameters) • deep, well-mixed elevated boundary layer • 700-500mb lapse rate > 7 C km-1 • surface-700mb theta-w > 17 C (mean mxr > 8 g kg-1) • average 12Z CAPE only about 250-300 J kg-1 • modest deep-layer (0-6km) shear • propagation into valleys dependent on: • mean wind in the cloud-bearing layer • ambient vertical wind shear • bouyancy of the surface inflow layer
Composite Sounding for 8 LVCZ EventsCAPE=625 J kg-1 Mean 1-4 km wind ~ 230/06 ms-1
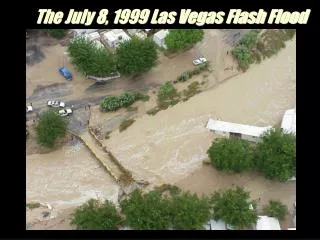
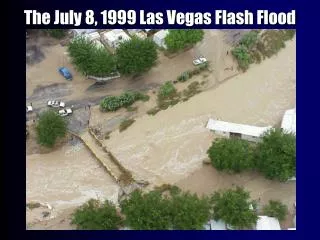
Classic Flash Flood SignaturesIllustrative Case: July 8, 1999
Monsoon Regime Challenges • continual fluctuation between subtropical easterlies and polar westerlies • poor sampling of short waves in easterlies • relatively poor density of surface data • typically low-shear environment (therefore, the primary ingredient = thermodynamics) • storm-relative inflow of buoyant air may be as important as cold pool-shear balance… but usually difficult to assess accurately
Forecasting Problems • DRA often not representative of LV valley • model soundings typically not very valuable • convective structure/evolution sometimes modulated by local circulations • what buoyancy/shear values signal potential for organized convection vs. isolated storms? • how can forecasters assess the influence of storm-relative inflow and internal feedback processes which alter the ambient conditions?
Transition Flow SignaturesIllustrative Case: August 10, 1997
DRA Sounding – 1200 UTC 10 August 1997 CAPE=654 J kg-1 Deep-layered Shear ~ 40 kt PW=27 mm
Conclusions • Accurate assessment of severe/flash flood potential requires understanding of processes which influence convective structure • relationship between buoyancy and shear • maintenance of unstable storm-relative inflow • The mode of convection frequently changes during the course of an event. • impact of local changes in stability, shear, lifting, etc. • interdependence of relatively large scale observable trends with complex, meso/storm scale circulations • Interplay between meteorology and hydrology can substantially influence a storm’s severity