Download
1 / 28
280 likes | 439 Views
UNITED NATIONS. FINANCIAL PRESENTATION. 12 October 2010 Angela Kane Under-Secretary-General for Management. Key Components. (US$ millions). 1. Key Components. (US$ millions). * Not including reserve accounts. 2. Regular Budget – Financial Position (US$ millions). * As at 1 January

E N D
UNITED NATIONS FINANCIALPRESENTATION 12 October 2010 Angela Kane Under-Secretary-General for Management
KeyComponents (US$ millions) 1
KeyComponents (US$ millions) * Not including reserve accounts 2
Regular Budget – Financial Position(US$ millions) * As at 1 January ** As at 13 October 2009 *** As at 5 October 2010 3
NumberofMemberStatespayinginfulltheirRegularBudgetAssessmentsatYear-EndNumberofMemberStatespayinginfulltheirRegularBudgetAssessmentsatYear-End IncludingMemberStatesowing lessthan$100 *At 5 October 2010,compared to 120 at 13 October 2009 4
FullyPaidfor Regular Budget Assessments* at 5 October 2010: 119 Member States** *Including Member States owing less than $100 **Compared to 120 Member States as at 13 October 2009 5
RegularBudgetAssessments Outstandingat 5 October2010 (US$ millions) 73 Member States Total outstanding = $787 million 6
RegularBudgetCashPosition (US$ millions) 7
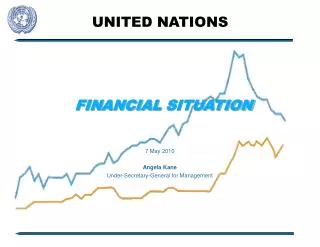
Regular Budget Cash Position* Actual and projected figures for General Fund for 2009 – 2010** (US$ millions) Final cash position for regular budget in 2010 – crucially dependent on payments of outstanding contributions from a few Member States * Does not include balances in Working Capital Fund and Special Account ** Estimates for October – December 2010 8
Peacekeeping–FinancialPositionat5 October2010 (US$ millions) * Including assessment for $408 million for UNMIL issued on 29 September 2010 9
UnpaidPeacekeepingAssessments (US$ millions) Total = $2,121 million Total = $3,191 million 10
FullyPaidallpeacekeepingassessments* dueandpayableat 5October2010: 11 Member States** • Including Member States owing less than $100 • * Compared to 19 Member States as at 13 October 2009 11
PeacekeepingCashat 5 October 2010 (US$ millions) TOTAL $4,510 million 12
ProjectedPeacekeepingCash at31December2010 (US$ millions) TOTAL $3,363 million 13
Closed Peacekeeping Missions Projected CashatEndof2010 CLOSED MISSIONS $435 million Less: $192 million for liabilities $243 million remaining 14
Amounts owed for Troops/Formed-Police Units and COE for 2009 - 2010(US$ million) * As per A/64/643, Table 10 (updated figures) 15
Projected 2010DebtSituation • Increase in new obligations compared to 2009 is primarily due to increased deployment of military and police personnel in UNAMID and deployment of additional military contingent and formed police units in MINUSTAH, partly offset by the reduction in the deployed military strength of UNIFIL and UNMIL. • Payments for troops/formed police unit costs are current up to August 2010 for all 13 active missions. Payments for contingent-owned equipment are current up to June 2010 for all 13 active missions. • Payment for COE/SS claims are contingent on the timely finalization of MOUs and subsequent claims certification by DFS. As of October 2010, out of 373MOUs for currently deployed units in peacekeeping missions, 59 MOUs (16%), primarily related to MINURCAT, MINUSTAH and UNAMID are yet to be finalized. • The amount owed to troop and police contributing countries as at 8 October 2010 takes into account payments of US$ 310 million for troop cost and US$ 217 million for COE made on 7 and 8 October 2010 respectively. Outstanding balance reflects 1 month of troops/formed police unit costs (US$ 101 million), COE liabilities for active missions (US$ 308 million), COE claims for closed missions and Letters of Assist (US$ 130 million), and Death and Disability Claims (US$ 1.7 million). 16
Amounts owed to troop-and police-contributing countries as at 8 October 2010 (US$ millions) 77 Member States TOTAL $541 million 17
International Tribunals – Financial Position * Including Member States owing less than $100 18
FullyPaidforTribunalAssessments* at 5 October 2010: 88 Member States** *Including Member States owing less than $100 **Compared to 83 Member States as at 13 October 2009 19
UnpaidTribunalAssessments as at 5 October 2010 (US$ millions) $ million * 5 October 2010 20
InternationalTribunalsAmountsOutstandingat 5 October2010 (US$ millions) 104 Member States Total outstanding = $50 million 21
International Tribunals Cash Position Actual and projected figures for Tribunals for 2009 – 2010* (US$ millions) * Estimates for October – December 2010 22
Assessments Payments as at 5 October 2010* Outstanding 2003-2009 2010 1,187 341 1,185 259 2 82 Subtotal 1,528 1,444 84 Future Amounts: 2011** Total 341 1,869 59 1,503 282 366 Capital Master Plan (CMP)(US$ millions) *Not Including payments to the Working Capital Reserve Fund. The WCRF was established at a level of $45 million with amounts received totaling $44.9 million * *Reflects future assessments (Option A), advance payments received as of 5 October 2010, and contributions which would become due upon assessment. 23
Capital Master Plan Cash Position* Actual and projected figures for CMP Fund for 2009 – 2010** (US$ millions) * Does not include balances in the Working Capital Reserve Fund. The WCRF was established at a level of $45 million with amounts received totaling $44.9 million. ** Estimates for October – December 2010 24
Albania Algeria Andorra Antigua and Barbuda Argentina Australia Austria Azerbaijan Bahamas Bahrain Belarus Belgium Belize Bosnia and Herzegovina Botswana Brazil Brunei Darussalam Bulgaria Burkina Faso Cambodia Canada China Colombia Costa Rica Croatia Cuba Czech Republic Democratic People's Republic of Korea Democratic Republic of Congo Denmark Ecuador Egypt Estonia Finland France Georgia Germany Greece Grenada Guatemala Honduras Iceland Indonesia Iraq Ireland Israel Italy Japan Kazakhstan Kiribati Kuwait Kyrgyzstan Lao People's Democratic Republic Latvia Libyan Arab Jamahiriya Liechtenstein Lithuania Luxembourg Fully Paid for Capital Master Plan Due and Payable* as at 5 October 2010: 113 Member States** Madagascar Malaysia Mali Malta Marshall Islands Mexico Monaco Mongolia Montenegro Morocco Mozambique Myanmar Namibia Netherlands New Zealand Nicaragua Nigeria Norway Oman Paraguay Philippines Poland Portugal Republic of Korea Romania Russian Federation Samoa San Marino Saudi Arabia Serbia Singapore Slovakia Slovenia South Africa Spain Sri Lanka Suriname Sweden Switzerland Syrian Arab Republic Tajikistan Thailand Trinidad and Tobago Turkey Turkmenistan Tuvalu Uganda Ukraine United Kingdom of Great Britain and Northern Ireland United Republic of Tanzania Uruguay Uzbekistan Venezuela (Bolivarian Republic of) Viet Nam Zimbabwe *Including Member States owing less than $100 ** Compared to 119 Member States as at 13 October 2009 25
All Assessments Due and Payable at 11 October 2010 Paid in Full*: 12 Member States** Australia Azerbaijan Canada Democratic Republic of Congo Denmark Germany Liechtenstein Netherlands Singapore Switzerland South Africa United Republic of Tanzania * Including Member States owing less than $100 ** Compared to 18 Member States as at 13 October 2009 26
CONCLUSIONS Financial indicators show a mixed picture for 2010, with improvement in some areas. Cash positions are projected to be positive at year-end for all funds, although the final outcome is dependant on last quarter contributions. Debt to Member States is projected to decrease to $430 million at end 2010, compared to $775 million at end 2009. Unpaid assessments reflect decreased levels compared to one year ago for all categories except for peacekeeping operations. The increase in unpaid peacekeeping assessments in 2010 is mainly related to the higher level of assessments in 2010. Unpaid assessments continue to be highly concentrated for all categories; however, for peacekeeping operations there continues to be some gradual improvement. 12 Member States had paid in full for all categories as at 11 October 2010, compared to 18 Member States one year ago. In order to maintain financial health of the Organization it remains as critical as ever for Member States to meet their financial obligations to the United Nations in full and on time. 27