Download
1 / 48
480 likes | 885 Views
Teach a parrot the terms " supply and demand " and you've got an economist. Thomas Carlyle . Demand, Supply, and Market Equilibrium. Chapter Objectives. Demand Defined and What Affects It Supply Defined and What Affects It How Supply & Demand Together Determine Market Equilibrium

E N D
Teach a parrot the terms "supply and demand" and you've got an economist. Thomas Carlyle Demand, Supply, and Market Equilibrium
Chapter Objectives • Demand Defined and What Affects It • Supply Defined and What Affects It • How Supply & Demand Together Determine Market Equilibrium • How Changes in Supply and Demand Affect Equilibrium Prices and Quantities • Surpluses & Shortages
Demand • Demand Defined • A schedule (curve) that shows the various quantities of a good or service that consumers are willing and able to purchase at various possible prices during a specific time period. • Law of Demand • Price and quantity demanded are inversely related (as price falls, qty demanded increases, and vice versa), ceteris paribus.
6 5 4 3 2 1 0 Price (per bushel) 10 20 30 40 50 60 70 80 Quantity Demanded (bushels per week) Individual Demand P Individual Demand P Qd $5 4 3 2 1 10 20 35 55 80 D Q
Individual DemandDemand Can Increase or Decrease P 6 5 4 3 2 1 0 Individual Demand Increase in Demand P Qd $5 4 3 2 1 10 20 35 55 80 Price (per bushel) D2 Decrease in Demand D1 D3 Q 2 4 6 8 10 12 14 16 18 Quantity Demanded (bushels per week)
Individual DemandDemand Can Increase or Decrease • A change in demand means a shift of the curve - • Demand will change (shift) if something OTHER than price changes (if one of the underlying assumptions changes) P 6 5 4 3 2 1 0 Individual Demand P Qd $5 4 3 2 1 10 20 35 55 80 Price (per bushel) D2 D1 Decrease in Demand D3 Q 2 4 6 8 10 12 14 16 18 Quantity Demanded (bushels per week)
Individual DemandChange in Quantity Demanded • Movement Between Any Two Points on a Demand Curve is Called a Change in QuantityDemanded • Movement along the demand curve can only be caused by a change in price of this good. P 6 5 4 3 2 1 0 Individual Demand P Qd $5 4 3 2 1 10 20 35 55 80 Price (per bushel) D1 Q 2 4 6 8 10 12 14 16 18 Quantity Demanded (bushels per week)
Individual DemandDeterminants of Demand (Shifters) • Tastes and Preferences • Some change that makes consumers want to buy more or less of the good or service. • Can be trends, fads, news reports of something bad for you (or good for you), change in tastes because of aging, etc.
Tastes & PreferenceDemand for My New Book, The Wonderful World of Economics What would happen to demand for my book if Oprah endorsed it on her show? 6 5 4 3 2 1 0 P Increase in Demand D2 D1 Q 2 4 6 8 10 12 14 16 18 Quantity Demanded
Individual DemandDeterminants of Demand (Shifters) • Tastes and Preferences • Number of Buyers (Market Size) • An increase in the number of buyers in a market, for whatever reason, will increase demand for a good (a decreases will decreases demand), ceteris paribus.
Market Size Demand curve for textbooks at UNCC What would happen to demand for textbooks if UNC Charlotte no longer required textbooks for classes? P 6 5 4 3 2 1 0 D1 Decrease in Demand D3 Q 2 4 6 8 10 12 14 16 18 Quantity Demanded
Individual DemandDeterminants of Demand (Shifters) • Tastes and Preferences • Number of Buyers (Market Size) • Income • Normal Goods • When income increases, demand increases (when income falls, demand falls).
Income (Normal Good)Demand curve for dinner at Carrabba’s Restaurant What would happen to demand for eating out if incomes increased? (assume Carrabba’s is a normal good) 6 5 4 3 2 1 0 P Increase in Demand D2 D1 Q 2 4 6 8 10 12 14 16 18 Quantity Demanded
Individual DemandDeterminants of Demand (Shifters) • Tastes and Preferences • Number of Buyers (Market Size) • Income • Normal Goods • When income increases, demand increases (when income falls, demand falls). • Inferior Goods • When income falls, demand increases (when income increases, demand falls).
Income (Inferior Good) Demand curve for ramen noodles What will happen to demand for Ramen noodles when you graduateand your income goes up? P 6 5 4 3 2 1 0 D1 Decrease in Demand D3 Q 2 4 6 8 10 12 14 16 18 Quantity Demanded
Individual DemandDeterminants of Demand (Shifters) • Tastes and Preferences • Number of Buyers (Market Size) • Income • Price of Related Goods • Substitute Good • Goods that are used instead of other goods. • When the price of one good increases, demand for it’s substitutes will increase (when price falls, demand for a sub will fall).
Price of Related Goods (Substitutes)Demand curve for Red Bull What will happen to demand for Red Bull when the price of Monster (another energy drink) goes down? (NOTE: There has been NO change in the price of Red Bull!) P 6 5 4 3 2 1 0 Buyers will substitute away from Red Bull to the relatively cheaper Monster. D1 Decrease in Demand D3 Q 2 4 6 8 10 12 14 16 18 Quantity Demanded
Price of Related Goods (Substitutes) Demand curve for BK Whoppers What would happen to demand for BK Whoppers if the price of McDonald’s Big Macs goes up? (no change in the price of Whoppers) P 6 5 4 3 2 1 0 Increase in Demand D2 D1 Q 2 4 6 8 10 12 14 16 18 Quantity Demanded
Individual DemandDeterminants (Shifters) of Demand • Tastes and Preferences • Number of Buyers (Market Size) • Income • Price of Related Goods • Substitute Good • Complementary Good • Goods that are used together. • When the price of one good increases, demand for it’s complement will decrease (when price falls, demand for a complement will increase).
Price of Related Goods (Complements) Demand curve for DVD’s When DVD players are more expensive, the quantity demanded of DVD players will fall (Law of Demand), so people do not buy as many DVD’s – demand will fall. What will happen to demand for DVD’s when the price of DVD players goes up? (NOTE: The price of DVD’s did not change) P 6 5 4 3 2 1 0 D1 Decrease in Demand D3 Q 2 4 6 8 10 12 14 16 18 Quantity Demanded
Price of Related Goods (Complements) Demand curve for iTunes downloads P 6 5 4 3 2 1 0 What will happen to demand for iTunes when the price of iPods goes down? Increase in Demand D2 D1 Q 2 4 6 8 10 12 14 16 18 Quantity Demanded
Individual DemandDeterminants (Shifters) of Demand • Tastes and Preferences • Number of Buyers (Market Size) • Income • Price of Related Goods • Substitutes • Complements • Consumer Expectations • If consumers expect prices to increase in the future, demand will increase today (if they expect prices to fall, demand will fall today)
Consumer Expectations Demand curve for houses What will happen to demand for houses when people expect home prices to fall in the future? Demand will fall today because homebuyers will wait to buy the home in the future when prices fall. P 6 5 4 3 2 1 0 D1 Decrease in Demand D3 Q 2 4 6 8 10 12 14 16 18 Quantity Demanded
Demand • Tastes • Number of Buyers • Income • Price of Related Goods • Consumer Expectations These are the assumptions underlying the demand curve. When they change, demand changes (shifts). There is one thing and one thing only that moves us along the demand curve (change in quantity demanded) – that is a change in the PRICE of the thing we are graphing.
NOTHING! No shift of demand, just a change in quantity demanded, movement along the curve. Change in PriceDemand curve for Starbucks Coffee What would happen to demand for Starbucks coffee if the price of Starbucks coffee goes up from $2 to $3? P 6 5 4 3 2 1 0 D2 D1 Q 2 4 6 8 10 12 14 16 18 Quantity Demanded
Supply • Supply Defined • A schedule (curve) that shows the various quantities of a good or service that suppliers are willing and able to make available for purchase at various possible prices during a specific time period. • Law of Supply • Price and quantity supplied are positively related (as price increases, qty supplied increases, and vice versa), ceteris paribus.
Supply Individual Supply P 6 5 4 3 2 1 0 S1 Price (per bushel) Q 10 20 30 40 50 60 70 Quantity Supplied (bushels per week)
SupplySupply Can Increase or Decrease Individual Supply P 6 5 4 3 2 1 0 S3 S1 S2 Price (per bushel) Q 2 4 6 8 10 12 14 Quantity Supplied (bushels per week)
SupplySupply Can Increase or Decrease A movement between any two points on a supply curve is called a change in quantity supplied P 6 5 4 3 2 1 0 Individual Supply S3 S1 S2 Price (per bushel) An increase in supply means a shift of the curve Q 2 4 6 8 10 12 14 Quantity Supplied (bushels per week)
Supply Determinants (Shifters) of Supply • Resource Prices • When costs of inputs increase, suppliers must supply less at every price, so supply will decrease.
Resource CostsSupply Curve for Toyotas P 6 5 4 3 2 1 0 What would happen to supply of Toyotas if the cost of steel increases? S2 Decrease in Supply S1 Q 2 4 6 8 10 12 14 Quantity Supplied
Resource CostsSupply Curve for Gasoline P 6 5 4 3 2 1 0 S2 Decrease in Supply What would happen to supply of gasoline if the cost of oil increases? S1 Q 2 4 6 8 10 12 14 Quantity Supplied
Supply Determinants (Shifters) of Supply • Resource Prices • Technology
Resource Costs Supply Curve for Big Screen TVs P 6 5 4 3 2 1 0 What would happen to supply of big screen TV’s if the technology used to build them improves? S1 S2 Increase in Supply Q 2 4 6 8 10 12 14 Quantity Supplied
Supply Determinants (Shifters) of Supply • Resource Prices • Technology • Taxes and Subsidies • Prices of Other Goods • Producer Expectations • Number of Sellers
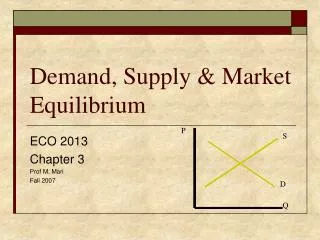
Market Equilibrium • Equilibrium Price • Equilibrium Quantity • Surplus • Shortage • Rationing Function of Prices
Market EquilibriumQuantity Demanded = Quantity Supplied Market Demand Market Supply Price 6 5 4 3 2 1 0 S P Qd P Qs $5 4 3 2 1 2,000 4,000 7,000 11,000 16,000 $5 4 3 2 1 12,000 10,000 7,000 4,000 1,000 D 2 4 6 8 10 12 14 16 18 7 Qty Demanded
Market EquilibriumWhat if P = $4 When price is above equilibrium, market has a surplus (QD<QS). Price 6 5 4 2 1 0 Market Demand Market Supply S Surplus P Qd P Qs $5 4 3 2 1 2,000 4,000 7,000 11,000 16,000 $5 4 3 2 1 12,000 10,000 7,000 4,000 1,000 3 D 7 2 4 6 8 10 12 14 16 18 Qty Demanded
Market EquilibriumWhat if P = $2 When price is below equilibrium, market has a shortage (QD>QS). Price Market Demand Market Supply 6 5 4 2 1 0 S P Qd P Qs $5 4 3 2 1 2,000 4,000 7,000 11,000 16,000 $5 4 3 2 1 12,000 10,000 7,000 4,000 1,000 3 Shortage D 7 2 4 6 8 10 12 14 16 18 Qty Demanded
Market Equilibrium When Market Price is Not Equilibrium Price Price 6 5 4 3 2 1 0 When market has surplus, price is too high. If market is allowed to operate freely, price will fall to equilibrium. When market has shortage, price is too low. If market is allowed to operate freely, price will rise to equilibrium. S Surplus Shortage D 2 4 6 8 10 12 14 16 18 7 Qty Demanded
Market Equilibrium • Change in Demand • Assume we begin at equilibrium price and quantity. What happens if something (a change in one of the underlying assumptions) shifts the demand curve?
Change in Demand Market for iTunes Downloads P 6 5 4 3 2 1 0 What would happen to demand for iTunes when the price of iPods goes down? D2 D1 Q 2 4 6 8 10 12 14 16 18 Quantity Demanded
Change in Demand Market for iTunes Downloads P 6 5 4 3 2 1 0 • Demand goes up. • Shortage at old price will put upward pressure on price. • Movement along supply curve as price increases. • Market finds new equilibrium. D2 D1 Q 2 4 6 8 10 12 14 16 18 Quantity Demanded
D1 Change in Demand Market for iTunes Downloads P 6 5 4 3 2 1 0 • Market finds a new equilibrium. • Equilibrium price goes up • Equilibrium quantity goes up D2 Q 2 4 6 8 10 12 14 16 18 Quantity Demanded
Changes in Equilibrium Price and Quantity Demand or Supply Shift • If one of the determinants of demand or supply change, the market will find a new equilibrium price and equilibrium quantity. • If only PRICE changes, equilibrium WILL NOT CHANGE. • Page 57 in the textbook has a good description of changes in equilibrium when something causes a shift of either curve (STUDY THESE).
Key Terms • demand • demand schedule • law of demand • diminishing marginal utility • income effect • substitution effect • demand curve • determinants of demand • normal goods • inferior goods • substitute good • complementary good • change in demand • change in quantity demanded • supply • supply schedule • law of supply • supply curve • determinants of supply • change in supply • change in quantity supplied • equilibrium price • equilibrium quantity • surplus • shortage • price ceiling • price floor
Wrap – UpDemand, Supply, and Market Equilibrium Demand Equilibrium Price and Quantity What Affects Demand (Shifters) Shift in Demand Supply Shift in Supply • Changes What Affects Supply (Shifters) Surplus Shortage