Download
1 / 11
110 likes | 170 Views
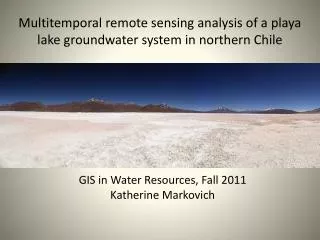
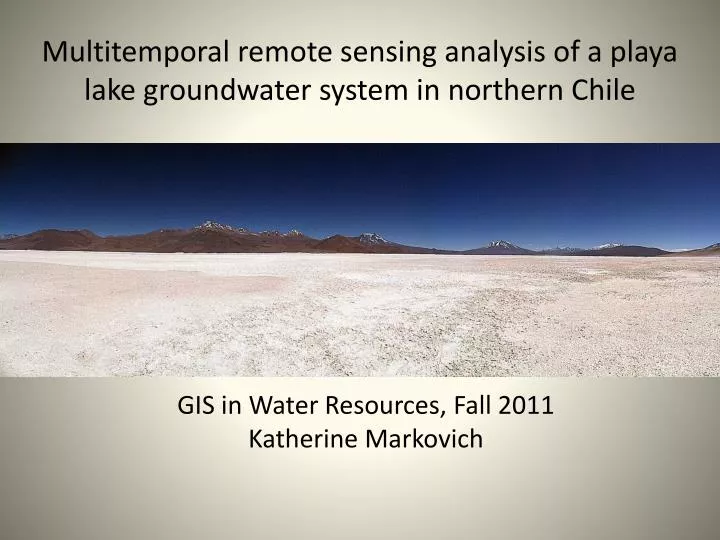
Multitemporal remote sensing analysis of a playa lake groundwater system in northern Chile. GIS in Water Resources, Fall 2011 Katherine Markovich. What is a playa lake or salar , and why do we care?.

E N D
Multitemporal remote sensing analysis of a playa lake groundwater system in northern Chile GIS in Water Resources, Fall 2011 Katherine Markovich
What is a playa lake or salar, and why do we care? Playa lake: an arid zone feature that is transitional between a playa, which is completely dry most of the year, and a lake (Briere, 2000). In this study, a salar is an internally drained evaporative basin with surface water occurring mostly from spring discharge. Image courtesy of Wikimedia Commons
Proposed regional groundwater system: Keller and Soto, 1998 Research Questions • Can we use remote sensing to quantify surface water extent on the salars? • Can we validate/refute PastosGrandesas the recharge zone for Ascotán? • Can we determine if pumping has affected the northern springs and/or the springs at Carcote? Hypothesis: Yes, remote sensing is useful for monitoring of remote areas over large spatial and temporal scales. In situ field data can supplement the remote sensing analysis.
Background Hydrology ( ) + assumptions = ΔV= (P+IGW+ISW) – (ET+OGW+OSW) Simple water budget for salars: ΔV= (IGW) – (E+OGW) ∆V=change in volume P=precipitation (rain/snow) ISW=surface water inputs IGW=groundwater inputs ET=evapotranspiration OSW=surface water outputs OSW=groundwater outputs Remote sensing gives us ΔA, which can be related to the groundwater system!
Methods Landsat Processing 1) Download from USGS Landsat Archive 2) Stack, project, clip using ESRI ArcGIS 10 -WGS 1984 Datum -UTM Zone 19S Projection -Nearest Neighbor Resampling • Landsat 4-5 TM and 7 ETM+ • 7-9 bands • 30m pixel resolution • Cloud-free • Orthorectified • Georeferenced 3) Classify water pixels using ERDAS Imagine 2011 -Convert to water extent -Quality control -Perform analysis with respect to climate, chemical, and pumping data
Results 1) Can we use remote sensing to quantify surface water extent as an analog to the regional groundwater system? • Optical Analysis • ‘False’ image • Qualitative only • Supervised • Classification • A priori knowledge • Possible Volume • NDWI • Xu, 2006 • Overestimates • Unsupervised • Classification • Casteñedaet al., 2005 • Depth/salinity
Results Initial Multitemporal Analysis for 2009 July December March May January
Results 2) Can we validate/refute PastosGrandesas a rechargezone for Ascotán? August, 1985 August, 1990
Results 3) Can we determine if pumping has affected the northern springs and ultimately the water extent at Carcote?
Summary • Developed a methodology to quantify surface water extent. • Found a positive correlation between the PastosGrandes caldera and water extent on the salars. • Total surface water extent has decreased since 1985, but it is not certain whether the cause is predominantly anthropic or climatic. • Carcote shows a muted response to the changes at Ascotán, but the hydrologic relationship between North and South Ascotán remains a question. Future Work: Continue remote sensing analysis by adding images, attempting to quantify volume, and addressing uncertainty. Further analysis of meteorological, hydrochemical, and pumping data from El Abra records and lab results. Possible precipitation modeling using NASA TRMM data