Download
1 / 15
150 likes | 305 Views
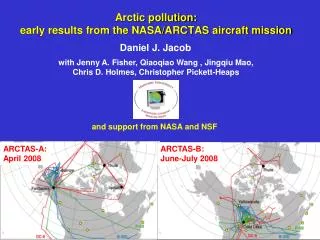
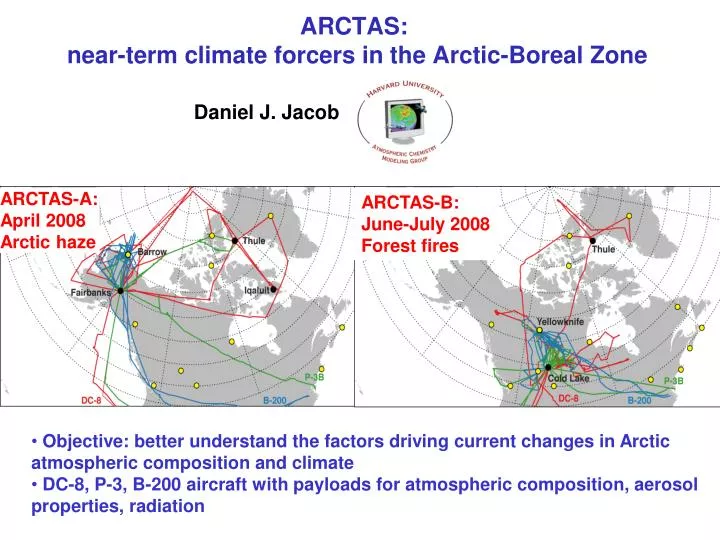
Daniel J. Jacob. ARCTAS: near-term climate forcers in the Arctic-Boreal Zone. ARCTAS-A: April 2008 Arctic haze. ARCTAS-B: June-July 2008 Forest fires. Objective: better understand the factors driving current changes in Arctic atmospheric composition and climate

E N D
Daniel J. Jacob ARCTAS: near-term climate forcers in the Arctic-Boreal Zone ARCTAS-A: April 2008 Arctic haze ARCTAS-B: June-July 2008 Forest fires • Objective: better understand the factors driving current changes in Arctic atmospheric composition and climate • DC-8, P-3, B-200 aircraft with payloads for atmospheric composition, aerosol properties, radiation
July 2008 April 2008 MODIS fire counts April 2008 Fire influences in ARCTAS Fairbanks Cold Lake Siberian fires, 2001-2009 April mean N. Saskatchewan fires, July
Interannual variability of Arctic spring pollution from AIRS COARCTAS demonstrated value of AIRS CO for tracking plumes over the Arctic 2003-2008 April mean AIRS CO Interannual anomaly (ENSO Index) 2003+ = 2004 = 2005 + = 2006 - = 2007 = 2008 - • European sector most polluted, N American sector cleanest • Transport of Asian pollution to the Arctic is correlated with ENSO through strength of Aleutian Low Fisher et al. [2010]
Spring Fine aerosol composition, spring Mean aerosol altitude-latitude curtains during ARCTAS Altitude, km Altitude, km Summer • Aerosol ls mostly sulfate and organic (OA) in spring, organic in summer • Aerosol loading is much higher in spring than summer • Mid-tropospheric maximum in spring Altitude, km Latitude, degrees J. Hair, NASA LaRC;Wang et al. [2011]
Seasonal, surface (winter-spring) Observed 2004-2008 2008 Model (w/source contributions) Vertical (spring) Sources of sulfate aerosol in the Arctic • Mix of sources in spring at all altitudes • Large Russian contribution in high Arctic in winter Fisher et al. [2011]
Low-altitude winter transport of Russian pollution to the Arctic Arctic front in January [Barrie and Hoff, 1984] GEOS-Chem SO2 emissions, Jan-Apr 2008 H • Emissions from Russia and Kazakhstan are readily transported to high Arctic in winter by surface circulation around Siberian High • There is enough photochemistry at 40o N to allow oxidation of SO2 to sulfate • Coal/petroleum production in Russia and Kazakhstan increased by ~50% between 2000 and 2007 Fisher et al. [2011]
Acidity of sulfate-ammonium Arctic aerosol in spring affects hygroscopicity, homogeneous freezing, ice nuclei properties NH4HSO4 (NH4)2SO4 • Arctic aerosol is generally acidic, less strongly in free troposphere • Dominant sources of ammonia are from fires and Asian pollution • Observed 1998-2008 increase in aerosol acidity at Barrow (Quinn et al., 2009) may reflect rising Russian source of sulfate Fisher et al. [2011]
Sources of carbonaceous aerosol in Arctic spring Mean ARCTAS vertical profiles Black carbon Organic aerosol • Organic aerosol is mostly from fires (even in normal fire years) • BC is mostly anthropogenic (even in 2008) • Correlations with sulfate, acetonitrile confirm this source attribution Shinozuka et al. [2010]; Wang et al. [2011]
BC deposition to snow: implications for radiative forcing Model vs. observed snow BC content, 2007-2009 BC deposition flux in 2008 (GEOS-Chem) open fires fossil+biofuel Winter JFM Spring AM • BC deposition is much higher in Eurasian than N. American sector • Fuel sources dominate over Arctic scale (>90% in winter, 60% in spring 2007-2009) • Snow albedo decrease from BC is estimated to be 0.4% (winter), 0.6% (spring) Wang et al. [2011]
ARCTAS: Barrow/Eslon Lagoon 15 April 2008 Lat 71.3˚ Lon -156.7; SZA 61.1˚ [Terra at 22:30 UTC] Coincident Snow Albedo & BRF from Surface, Aircraft, and Satellite Best ever multi-scale observations 4/16 00:00 UTC 4/15 23:00 UTC 4/16 01:00 UTC P3 Aircraft 4/15 22:30 UTC SSFR Albedo Spectra From: Schmidt, Bierwirth Surface Albedo Spectra (Elson Lagoon) From: Brandt, Pedersen… 4/15 22:00 UTC P-3 Flight Path Barrow AERONET Site 4/15 21:00 UTC Ground Measurements 4/15 20:00 UTC Terra Satellite/ MISR CAR Spectral BRF From: Gatebe From: Kahn, Davis
contours: GEOS-Chem circles: AERONET (2008) Arctic aerosol optical depth (AOD) MAM JJA • AOD is mostly from sulfate in spring, OC (fires) in summer • Saharan dust also makes a significant contribution • The large AOD decrease from spring to summer reflects in part smaller sulfate particles r=0.56 bias=+14% seasonal source contributions to Arctic AOD (>66N) Breider et al., in prep.
Arctic aerosol Properties in summer Mean aerosol size distribution and composition Fresh Biomass Burning Boreal Forest Background High Arctic Background Most of the aerosol is water-soluble organic material, which is hygroscopic and effective as CCN Lathem et al., in prep.
Pyrocumulus optical properties observed in ARCTAS • A. Strong light extinction detected in the core of dense fire clouds (pyroCu). • B. Radiation transport in pyroCu is inherently a 3D problem and must account for particle absorption. ARCTAS provide unprecedented data. • C. Angular radiance distribution in dense pyroCu clouds is very complex. This study developed new simple diffusion approximations in place of 3D RT, which reproduce all angular features accurately. A. Transect of pyroCu Pictures B. Radiative transfer in pyroCu C. Spectral-angular features of pyroCu (core) 1.00 1.00 1.04 µm 0.90 0.95 NASA P-3 1.04 µm Relative Radiance 0.87 µm 3D radiative transfer 0.80 0.90 0.68 µm 0.68 µm 0.47 µm 0.47 µm 0.85 0.70 0 60 120 180 0 60 120 180 Zenith angle Zenith angle Gatebe et al 2012, Atmos. Env. 52, 121-130
Methane emissions from Hudson Bay Lowlands Observed GEOS-Chem (no HBL emissions) Jul 4 Jun 23 Jul 5 May 5 Pre-HIPPO ARCTAS • Emission from HBL started only after snowmelt • ARCTAS + surface (Fraserdale) constraints imply annual methane emission from HBL of 2.3 Tg a-1 , several-fold higher than inferred from ABLE-3B (1990) • The ARCTAS spring deployment observed no methane enhancements anywhere Pickett-Heaps et al. [2011]
Boreal fire plumes in ARCTAS in summer showed no significant ozone enhancement • NOx emission from fires was lower than assumed in standard inventories • Emitted NOx was locked up as PAN (stable reservoir) within a few hours • Lack of ozone enhancements was consistent withTES satellite data • Subsequent decomposition of PAN eventually produces ozone but mostly outside the Arctic Alvarado et al. [2010]; Hecobian et al. [2010]