Download
1 / 35
350 likes | 615 Views
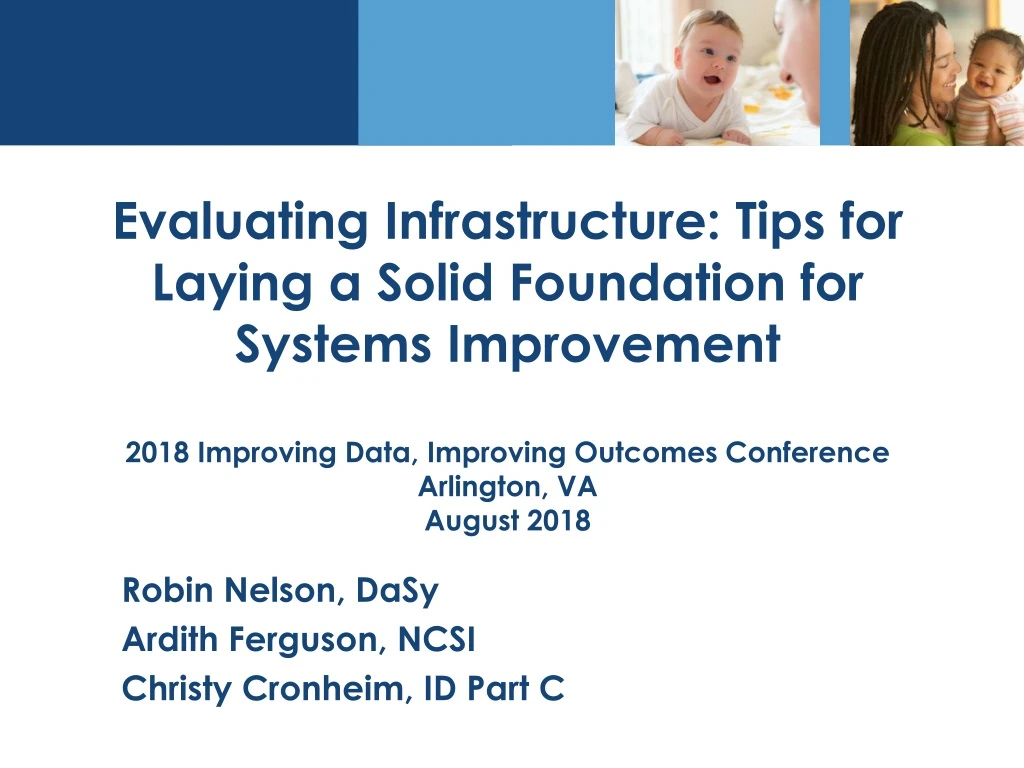
Evaluating Infrastructure: Tips for Laying a Solid Foundation for Systems Improvement 2018 Improving Data, Improving Outcomes Conference Arlington, VA August 2018. Robin Nelson, DaSy Ardith Ferguson, NCSI Christy Cronheim, ID Part C. Intended Outcomes. Gain awareness of:

E N D
Evaluating Infrastructure: Tips for Laying a Solid Foundation for Systems Improvement2018 Improving Data, Improving Outcomes ConferenceArlington, VAAugust 2018 Robin Nelson, DaSy Ardith Ferguson, NCSI Christy Cronheim, ID Part C
Intended Outcomes • Gain awareness of: • Evaluation terminology • How to develop or refine outcomes related to performance indicators • Measures and tools • Considerations for data analysis and use of data
What are we measuring and why? • Increase understanding of why measuring both the progress of implementing infrastructure improvements and their impacts are important components of your evaluation plan • Develop or refine specific outcomes and related performance indicators to measure infrastructure change • Align evaluation questions, outcomes & performance indicators to Theory of Action
Reason for High-Quality Systems Good outcomes for children with disabilities and their families
Extra Steps for a High-Quality System Good outcomes for children with disabilities and their families Implementation of Effective Practices Increase quantity, e.g., scaling up Increase quality Sustainability
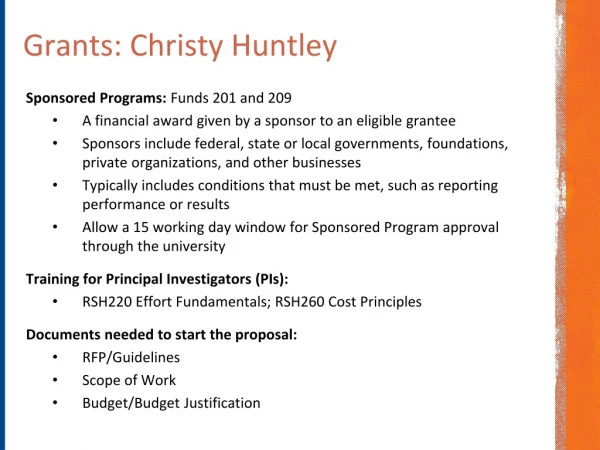
Idaho’s Decision on Infrastructure in SSIP • Massive undertaking • Requirement • Recognize importance in supporting practices, workloads, scaling up
Evaluation Plan Components • Evaluation Questions • Process/implementation • Outcomes • Outputs and Outcomes • Performance Indicators • Measurement/Data Collection Methods
Progress Implementing an Initiative • Evaluate progress: How is implementation going? • Not simply describing the activities that were implemented but relate them to the initial analysis • Reporting on benchmarks or other indicators of system change • Evaluate outcomes: What changes are we seeing? What’s the impact of those changes? • How will the infrastructure support local programs to implement EBPs? • How will the infrastructure support scaling up and/or sustainability?
Outputs and Outcomes, including Levels (Hierarchy) of Evidence • Outputs • Direct results of activities, products/events, number of client contacts with products/events • Short-term outcomes • Reactions, awareness; learning, knowledge • Intermediate outcomes • Behaviors/actions; organizational or system functioning • Long-term outcomes/impacts • Impact(s) on children/families; impact(s) on system, program sustainability
Alignment Considerations of Outcomes, Questions, and Performance Indicators
Example Evaluation of Implementation Output or Outcome? How can we transform the output into an outcome and revise performance indicator to be better aligned?
Importance of Alignment • Theory of Action (TOA): A graphical summary of hypotheses about how an improvement strategy works. The TOA will be tested by the evaluation. • Improvement Strategies: Strategies that outline the course of action in achieving the Theory of Action. • Evaluation Questions: The key questions the state wants to learn and answer through the evaluation. • Performance Indicator: An item of information that provides evidence that a certain condition exists or that certain results have or have not been achieved.
Key Take-Away Points • Alignment, alignment, alignment • Focus must be on desired outcomes • More than 1 component of infrastructure • Outcomes are not static • There is no one way
How are we measuring? • Identify appropriate measures/tools, including the System Framework Self-Assessment, that they will use or continue to use in measuring infrastructure change. • Align outcomes and measurement.
Considerations for Infrastructure Measurement • Broad vs. specific outcome measures • Broad: Self-assessment of progress on indicators of infrastructure • Specific: Measures of specific changes • Consider levels of evidence • Data sources • Data collection strategies • Data collection schedule/frequency
ID Use of Framework Self-Assessments** • System Framework: Personnel/Workforce • Subcomponent 7, PD and TA • Time points: 3/14, 3/18, “post measure” 2019 • State Child Outcomes Measurement System (S-COMS) Self-Assessment • Purpose, Analysis, Using Data, Evaluation components • Baseline 5/15, interim 3/18, “final” 2019 • Checklist for Implementing a Primary-Coach Approach to Teaming • Preparing for a Team-Based Approach component • Baseline 3/18, 2019, annual measure
ID Data from the State Child Outcomes Measurement System Self-Assessment
Measurement Tools/Approaches • System Framework Self-Assessment • Size, scope - knowing where to start • Built-in benchmarks and milestones • Other frameworks, e.g., Child Outcomes Measurement • Other topic-specific tools, even self-assessments, can be adapted for data collection, e.g., through surveys, interviews or focus groups • Measures of specific (vs. broad) infrastructure change
Key Take-Away Points • There are existing tools you can leverage • Alignment, alignment, alignment • Align measurement & analysis with performance indicator and evaluation question • Relate short-term outcomes to one or more areas of infrastructure • You can evaluate infrastructure based on change or comparison to a standard • There is no one way
What do we do with all these data? • Develop and refine strategies for data analysis and data use • Increase knowledge of when and how to use qualitative data
Working with Data: Tip Sheet • Types of data • Quantitative • Discrete/categorical vs. continuous • Qualitative • Data transformations • Combining, reducing, creating new variables • Examine the distribution of your data to help make decisions
Reasons to Review Distribution $78K $70K $80K $75K $82K $76K $580 K
Two sets of data, both with mean =3.75 Percent Percent
Qualitative Data • Use qualitative data when • Focus is exploratory, identify questions to ask • Information you want is not easily quantifiable • Need rich, detailed understanding of an issue • Best Practices • Alignment with evaluation questions • Planning, training, written procedures • Systematic analysis of data
Qualitative Data: • Statewide scale-up for ECO process and tools • Monthly check-ins • Focus groups • Training evaluations • Social emotional tools • Direct feedback from ICC, hub leaders and EI providers • EPSDT trainings • Direct feedback from hub leaders and EI providers • Data system user testing
Pay Me Now or Pay Me Later:Overlooked Topics • Data management – how will you enter, transmit and store the data • Strategies for improving data quality • Pre-, during and post-data collection • Data analysis plan – • Relationship between data analysis and performance indicators • Document changes in data collection measures/procedures
ID Stakeholder Engagement • ECO process and tools • Exploration team • Exploration workgroups • Hub Leaders • ICC • Family survey questions • ICC, Idaho Parents Unlimited • EPSDT development and implementation • Hub leaders and early intervention providers
Key Take-Away Points • Remember to address data management and data quality; use quality • There are various ways to reduce or transform data • Qualitative information can bring life to numbers • Data visualization can help to engage stakeholders in data analysis and interpretation
Summary Of Takeaways • A • P • O • L • C • N • Alignment, alignment, alignment • Progress – evaluate incremental progress • Outcomes and impact of changes • Leverage existing tools • Change OR comparison to standard • No one way • See Handout 5 for additional resources
Thank You! The contents of this presentation were developed under grants from the U.S. Department of Education, # H373Z120002, #H326P120002, H326R140006, and H373Y130002. However, those contents do not necessarily represent the policy of the U.S. Department of Education, and you should not assume endorsement by the Federal Government. Project Officers: Meredith Miceli, Richelle Davis, Julia Martin Eile, Perry Williams, and Shedeh Hajghassemali.