Download
1 / 52
520 likes | 528 Views
Learn the six-step problem-solving process model to identify concerns, analyze problems, evaluate alternatives, propose solutions, and analyze outcomes for continuous improvement.

E N D
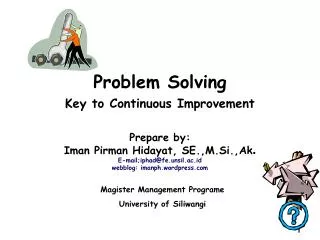
Problem SolvingKey to Continuous ImprovementPrepare by:Iman Pirman Hidayat, SE.,M.Si.,Ak.E-mail;iphad@fe.unsil.ac.id webblog: imanph.wordpress.com Magister Management Programe University of Siliwangi
1. Identify Concerns and problem V V 6. Improve the Process 2. Analyze the Problem V V 5. Analyze the Outcome 3. Evaluate the Alternatives V V 4. Propose and Implement the Solution The Six Step Problem Solving Process Model
Six Steps Problem Solving Process Step 1. Identify Concerns (How urgent or important is this?) • Identifying the gap • Smoke out the issues to the team or organization • Use analysis reports such as check sheets, Pareto charts • Use questions to probe for understanding of real issues which require further investigation • List areas of concern and the consequences of not taking action eg. Defects, tardiness, attitude • Proceed to identify concerns • Keep asking to surface the real issues • Team to get agreement on area of mutual concern
Six Steps Problem Solving Process Step 2. Analyze the Problem • Investigate in Detail (gather and evaluate the facts) • Write a statement that identifies the root problem • Use appropriate tools and techniques • Checksheets, reports, observations • Brainstorming (Alex F. Osborne, Applied Imagination, 1957) • Force Field Analysis (Kurt Lewin, Field Theory in Social Research, 1955) • Cause and Effect Diagram or Fish Bone Diagram • Ensure active participation • Build consensus • Proceed to analyze the problem • Team agreement that area of mutual concern has been sufficiently analyzed • Allow for constructive criticism and concerns to be shared
Steps One and TwoAnalysis Summary Key things that the team should have: • Looked for patterns or trends during the analysis. • Recurring themes point toward a definition • Define barriers, as necessary. • A clear definition of these barriers is necessary when preparing an action plan • Used brainstorming techniques to open up discussion • All ideas are acceptable • Get as many as possible • Involvement leads to ownership and commitment
Six Steps Problem Solving Process Step 3. Evaluate alternatives (most critical step) • Test your problem analysis • Establish priorities and • Set criteria in an effort to establish a goal (refer next slide) • Enables a wider perspective of possible solutions which tend to be more mutually acceptable by team. This in turn leads to higher commitment by the group
Step Three – Evaluate Alternatives Tool For Alternative 1, Example of Requirements M = timeframe to complete N = cost of implementation 1. Establish priorities List absolute requirements (points value) Pts Reqmt M N O 10 <6 wks <$300 8 >6-7 >$300 - $400 6 >7-8 >$400-$500 4 >8-9 >$500 - $600 2 >9 >$600 List Desirable Objectives (points value) Pts Reqmt x y z 10 >0.50 8 >0.40 6 >0.30 4 >0.20 2 >0.10 Example of Requirements x = UMH
Step Three – Evaluate Alternatives Tool Alternative 1: Alternative 2: Alternative 3: 2. Establish Priorities - Evaluate Alternatives 24 pts 18 pts Absolute Requirements Pt value 8 6 6 6 Reqmt M N M N Pt. Total Pt. Total Pt. Total 14 12 Desirable Objectives Pt value 10 6 Objective x x Pt. Total 10 Pt. Total Pt. Total 6
Step Three – Evaluate Alternatives Tool • Criteria of this Alternative • Set your criteria 1. Does this alternative express your desired achievement? _________________________________________________________________________________________________________________________________________________________ 2. Does this alternative express what you need to preserve? _________________________________________________________________________________________________________________________________________________________ 3. Does this alternative express what you need to avoid? _________________________________________________________________________________________________________________________________________________________
Six Step Problem Solving Process Step 4. Propose and Implement the Solution • Develop a plan of action • Specify steps to be completed • Determine resources needed to implement plan • Group member responsibilities to be agreed upon • Determine timeline of events • Provide for emergencies and/or contingencies • Determine expected impact and actual impact • Plan for assessment of your proposed plan
Step Four – Solution Creation Tool Decided upon solution:
Step Four – Action Planning Tool Plan to assess Action Plan results : (list tools used eg Pareto charts, trend charts etc)
Six Step Problem Solving Process Step 5. Analyze the Outcome • Follow through is critical • Analysis follow through • Validate the entire process • Dissemination and analysis of improvement results • Determination of new problems that surfaced • Revisit the process as necessary • Problem Recurrence Prevention intervention • Institutionalization
Six Step Problem Solving Process Step 6. Improve the Process • Continue the improvement • Link to Step 1 – Identify Concern (initiates the process again) • Step 6 also verifies your commitment to continuous improvement • Evaluate what you do on a daily basis • Rethink and change the way you do things • Eliminate non-value added activities • Accept responsibility and ownership for problems for which you are part of the solution Problem Solving is an ongoing process
Six Steps Problem Solving ProcessImportant Considerations Project selection • Project clearly defined • Customer oriented • Business Impact Analysis technique • Thorough and appropriate analysis techniques used • Benchmarking of best practices Remedies • Use the simplest tools • Alternative solutions seriously explored • Remedies consistent with analysis • Implementation plans thorough and well defined Results • Verified improvements measured • Customer satisfaction results evident Institutionalization • Improvements sustainable and permanent
Tool 1 - Tally Sheet (Check Sheets) • To analyze the situation and look at important questions. • Uses : • To grasp the past and present situation • To stratify • To grasp the changes through time • To confirm the standard
Tool 2 - Pareto Diagram Cummulative Percent • From the tally sheets, identify the few main problems to tackle. • Uses : • To grasp the problem better • To grasp the past and present situation of the problem • To stratify • To confirm the improvement results
Tool 3 - Cause and Effect Diagram A B Effect D C • The Effect (results which is influenced by the main factors or Causes) are placed in a fish bone diagram. Using this diagram will help to identify the real causes • Uses : • To grasp the causal relationship between cause and effect • To stratify • To analyze the possible causes
MAN MACHINE MOTHER NATURE H H H Lack of Training (Sales force, Drivers etc.) H M H Complex order entry systems Sorting errors M M H Theft/Missing L H H Damaged L H H Customer not there Short Ship (human error) L M H Addresses not input correctly H M H Bad Weather L H H Holidays (Public & Customer) L L L Strikes L H H Viruses L H H Customs Delays (exams) L H H Multiple order entry systems 2 WIP systems (Tandem & Speedway) M H H Break in EDI link L H H Short Ship (system error) Address change (order entry and Speedway) H H M H H H H H H H H H Improved Delivery Time Mis-use of reason codes L L L Inconsistent data by Carrier H H L Data lags real time; not ‘on-line’ EMF 2 & 3 difference (Dock doors, volume, products, Manifest, etc.) M H H Production by product (not destination) L H L Futuristic orders Split shipments (EMF 2 & 3) L H H Inaccurate Customer order statusing Shipping mis-route M M H Truck departure policy Technical Issues (Truck, Ferry, Plane) L H H Customs Delays (Documentation) L M H H H H H H H A) Occurrence B) Difficulty of Control C) Impact H H H MEASURE MATERIAL METHOD Project ExampleAnalyze: Root Cause and Proposed Solutions
Tool 4 - Scatter Diagram . . . . . Y . . . . . . . . . . . . . . . . . . . . . . . . . . . . . . X To study the correlation between X and Y • Utilizing two sets of data to plot them onto the vertical axis and horizontal axis. From the analysis of the situation, we can see the congenial relationship of the data • Uses : • To grasp the past and present situation • To grasp the correlation
Tool 5 - Histogram • Data has a tendency to be centered upon a maximum of large numerical value, and from there it spreads out, gradually decreasing. The analysis of the situation is placed in columnar form • Uses : • To grasp the past and present situation • To stratify • To identify the extent of the problem • To confirm the improvement results
Tool 6 - Control Charts UCL LCL • A line graph used to grasp the variation in the data which is entered through planning the control limit lines of a centre line, an upper control limit and a lower control limit. • Uses : • To discover the variables • To grasp the control situation
Pie Chart Tool 7 - Graph • Useful information about control and improvement is plotted onto diagrams which are visual and easily comprehensible. Column graphs, line graphs, pie charts, belt charts, radar charts and others. • Uses : • To analyze the cause • To record the time and contents • To record the time and schedule control • To grasp the large and small numbers and time changes • To track trend
Tool 8 - Relations Diagram Cause 1 10 9 2 Problem Area 6 3 8 5 7 4 • To solve problem by rationally seeing the relationship between “Cause – Results”, and “Objective – Measures”, where complicated circumstances are interwoven into the problem • Uses : • To grasp the causal relationship between cause and effect • To grasp the relationship between objectives and measures • To grasp the problem areas
6 W Why What Where When Who Which 2 H How How many Enforced Problem Solving 6 Ws and 2 Hs Look at current processes, systems, methods and ask questions!
Questioning & Listening - key skills Tools/techniques Problem Solving Process Key Components Thinking Process
Info No Enough? Solved? Yes Use Tools & Techniques No Yes Monitor Problem Solving Process It’s about information processing. It is about getting the right information!!
Process Gather Sort Organize Analyze Confirm Thinking Thinking and Action Process Input Information Experience Judgment Knowledge Action Creativity Decision Making Speed of Execution Results Concern Resolved Questioning & Listening Skills Making decision and taking action are critical to learning and understanding the problem resolution
Team Member Interaction StylesThe Power of Group Diversity • Contributors • People who concentrate on individual, task-oriented effort • Synthesize ideas • Assess risks • Summarize process status • Provide expertise • Collaborators • People who see the big picture, the ultimate goal of the team • Set standards/rules • Generate ideas • Test ideas • Negotiate solutions • Communicators • People who ensure everyone’s views are expressed and keeps everyone talking • Encourage participation • Provide compromise • Reflect feelings • Support others • Challengers • People who question the leaders and members to keep the team on track • Provide ideas • Criticize answers • Defend ideas
Communication Skills Questioning Unraveling the unknown Listening Building trust and respect Learning from others
Questioning Unraveling the unknown
Problem Solving Skills Questioning • Questioning Is a Key Skill • Success in process depends on using a systematic approach and asking questions effectively • Effective questions understand : • Intent behind their questions • The assumptions they have made • The importance of choosing words carefully • Where they are likely to get the answers
Characteristics of an effective question • Clear • for easy communication • Relevant • to the time and topic in discussion • Specific • to the point in discussion
Types of Questions and Uses • Open – to explore, understand further, solicit information • Begin with What, When, How, Which, Where, Why, Who • Require explanation/description in the answer • Closed – to confirm agreement, to move on to next topic • Lead to a yes or no answer • Elicit only the answer to that specific question • Reverse – to clarify, evaluate ideas,/views, seek ideas/opinions • Asking back the question and getting associates to think for themselves • Leading – direct flow to desired direction • Indicates the desired/expected response
Probing Questions • 5Ws + 1H • Why 5X
Brainstorming Technique • Brainstorming – getting maximum group participation • “The best way to get a good idea is to get a lot of good ideas” – Linus Pauling • Use for generating alternative solutions to a problem • Leader describes the problem • Everyone takes a few minutes to think • Capture ideas visibly • Group or categorize ideas (eg. use fish bone daigram) • Lastly, evaluates the best ideas • Rules : • Go for quantity • Allow for the absurd. Fantasy etc • Do not criticize, challenge, question or pre-judge idea yet • Piggy back on each idea • Use open-ended questions to stimulate more ideas • Go round fast when seeking ideas • Encourage full participation – round robin technique • Write ideas visibly (on flip chart)
BenchmarkingBenchmarking is the sistematic and continues process of determining what the best performance and underying skills of leading organizations are in their pursuit for excellence, and base on this, of stimulating the organizaton’s own strife for excellent performanceat all organizational levels (Camp,1992) 1 What should be benchmarked 8 Implement & monitor the plans 2 Identify the bencmark partner 7 Develop action plans 3 Gather Data The bencmark process 6 Formulate functional goals 4 Analize the Data 5 Determine the performance gap
V V V V V V The Six Step Problem Solving Model Identify Concerns and problem Improve the Process Analyze the Problem Analyze the Outcome Evaluate the Alternatives Propose and Implement the Solution
Problem Solving Process Define (Plan Project) Report (Document & leverage outcomes) Measure (Collect data & ideas) Problem Solving Model Control (Maintain critical factors at required level) Analyze (Identify critical factors) Improve (Critical factors to Improve or eliminate)
Ford 8 D Problem Solving Problem Resolved Initiate Project Team 8 Recognize Project Team 7 Prevent Problem Recurrence Steps 6 Implement Corrective Actions Develop and Verify Solution 5 4 Identify Root Causes 3 Implement Containment Actions 2 Define Problem 1
Kepner-Tregoe Problem Solving and Decision Making Process Avoid Jumping to Cause Problem Analysis Sort out Priority Concern Balance Benefits and Risks Decision Analysis Situational Appraisal Avoid Reactive Action Potential Problem Analysis
Problem Solving & Decision MakingModel Problem Analysis 2. Analyze the problems Situation Appraisal Decision Analysis 3. Generate and evaluate alternative solutions 4. Propose and Implement Solution Potential Problem Analysis 1. Identify concerns or issue 5. Analyze the outcome 6. Improve the process
V V V V V V 1. Identify Concerns and problem Check Sheet, Yield Log Sheet Pareto Diagram Questioning Techniques Tools At Each Step 2. Analyze the Problem 6. Improve the Process Stratification, C&E diagram, Histogram Relationship diagram, Force Field Analysis Questioning, Brainstorming Techniques Trend chart, Control chart 5. Analyze the Outcome 3. Evaluate the Alternatives Evaluate alternatives tool, Prioritization tool, Criteria (requirements, objectives) evaluation tool, Experiment or simulation, Questioning Techniques Trend chart, Control Chart, Paired Pareto diagram, Paired Histogram, Radar Chart, Graphs, Scatter Diagram Improvement Analysis tool 4. Propose and Implement the Solution Solution Creation Tool Action Planning Tool Gantt Chart